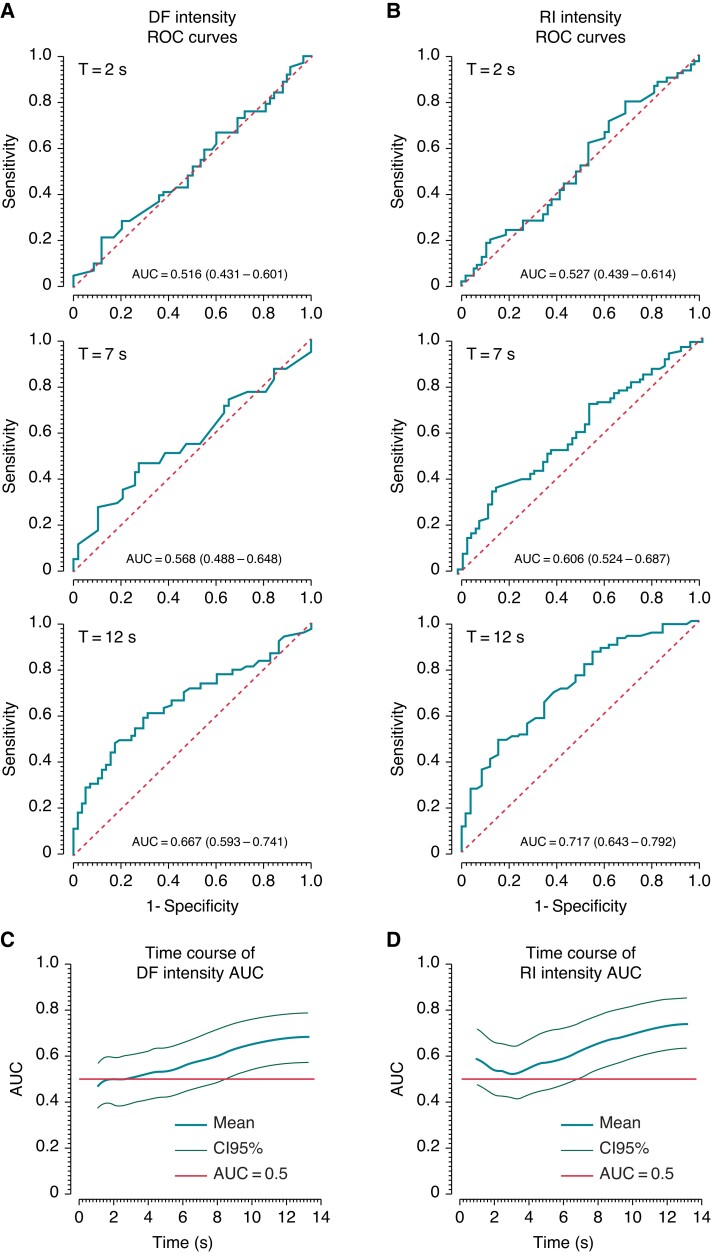
Figure 4.
Self-termination predictive value of the DF and RI intensity. Panels A and B display sample ROC curves for DF and RI intensities, respectively, at 2 (top), 7 (middle), and 12 s(bottom) from the beginning of the analyzed episodes. AUC is seen to progressively increase from 2 to 12 s for both DF and RI intensities. Panels C and D plot the time course of the AUC values for DF and RI intensity, respectively, with 95% confidence interval limits (light green traces). Red horizontal lines illustrate AUC = 0.5 levels. AUC, area under the curve; DF, dominant frequency; RI, regularity index; ROC, receiver operating characteristic.

