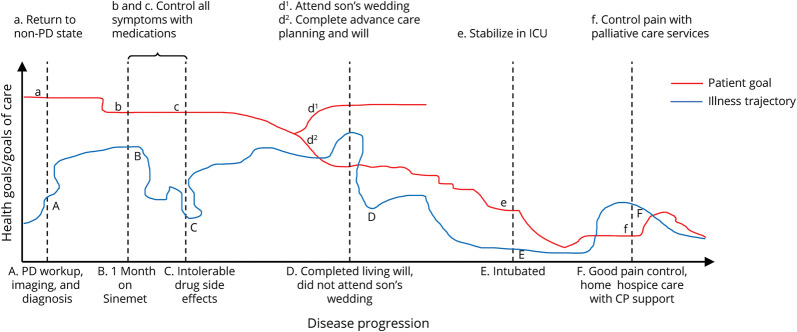
Figure 2. A Parkinson Disease Chaos Narrative.
This graph applies the chaos narrative framework from Figure 1B to an imagined, representative PD illness course (the x-axis label is displayed to the right of the axis for ease of annotation). Each vertical marker marks a point in a patient's PD journey—points on the illness trajectory curve are marked with a capital letter and described at the bottom of the graph, and points on the patient goal curve are marked with a corresponding lower-case letter and described at the top of the graph. Vertical markers where the patient goal surpasses the illness trajectory represent times where a patient's PD progression is limiting them from reaching their health goal. For example, at point b, the patient's goal is to control all their symptoms on medication, but point B on the illness trajectory curve shows that the Sinemet is providing only partial relief. Vertical markers where the illness trajectory surpasses the patient goal represent points when a patient is surpassing their health goals. For example, at point f, the patient's goal is to control their pain, but point F on the illness trajectory curve shows that their pain is not only controlled but they are also benefiting from home hospice with their care partner support.

