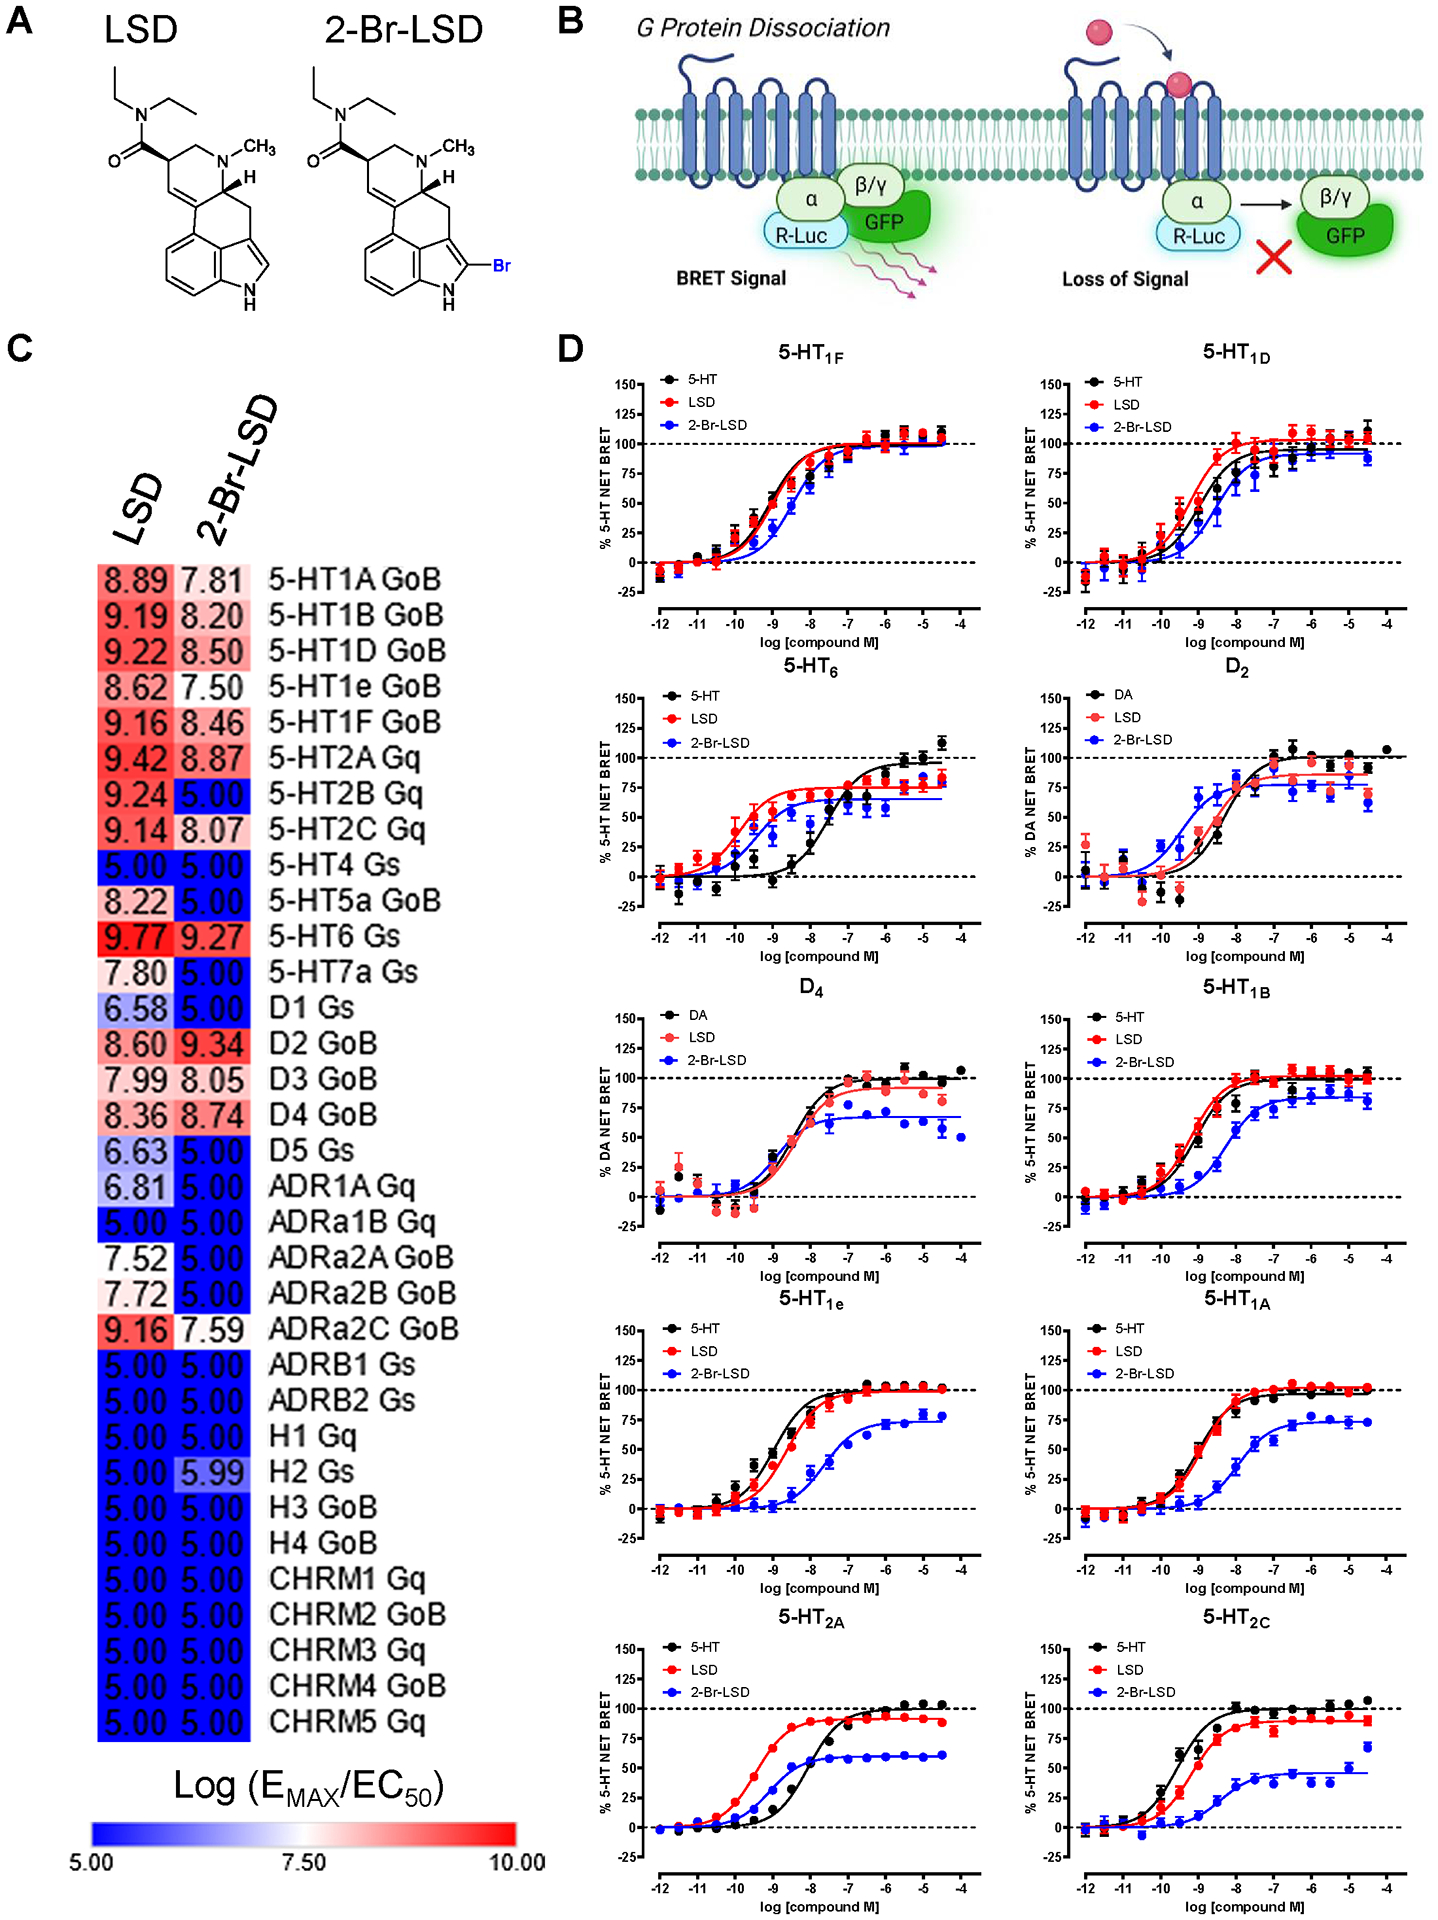
Figure 1. Profiling 2-Br-LSD across the Serotonergic and Aminergic GPCRome.

(A) Chemical structures of LSD and 2-Br-LSD. (B) Aminergic-ome G protein dissociation BRET assay schematic. (C) Heat map showing relative agonist activity (log(EMAX/EC50) comparing LSD to 2-Br-LSD at 33 aminergic GPCR targets measuring G protein dissociation at 37°C and 60 minutes (see Table S1). (D) Top ten targets of 2-Br-LSD agonist activity in the BRET aminergic GPCRome activity assays comparing 2-Br-LSD (blue) to LSD (red) and positive control (black; 5-HT for serotonin receptors and DA for dopamine receptors). Data represent mean ± SEM from at least n=3 independent experiments performed in triplicate, and are all normalized to their respective positive control. Related to Fig. S1, S2 and Tables S1–S3.
