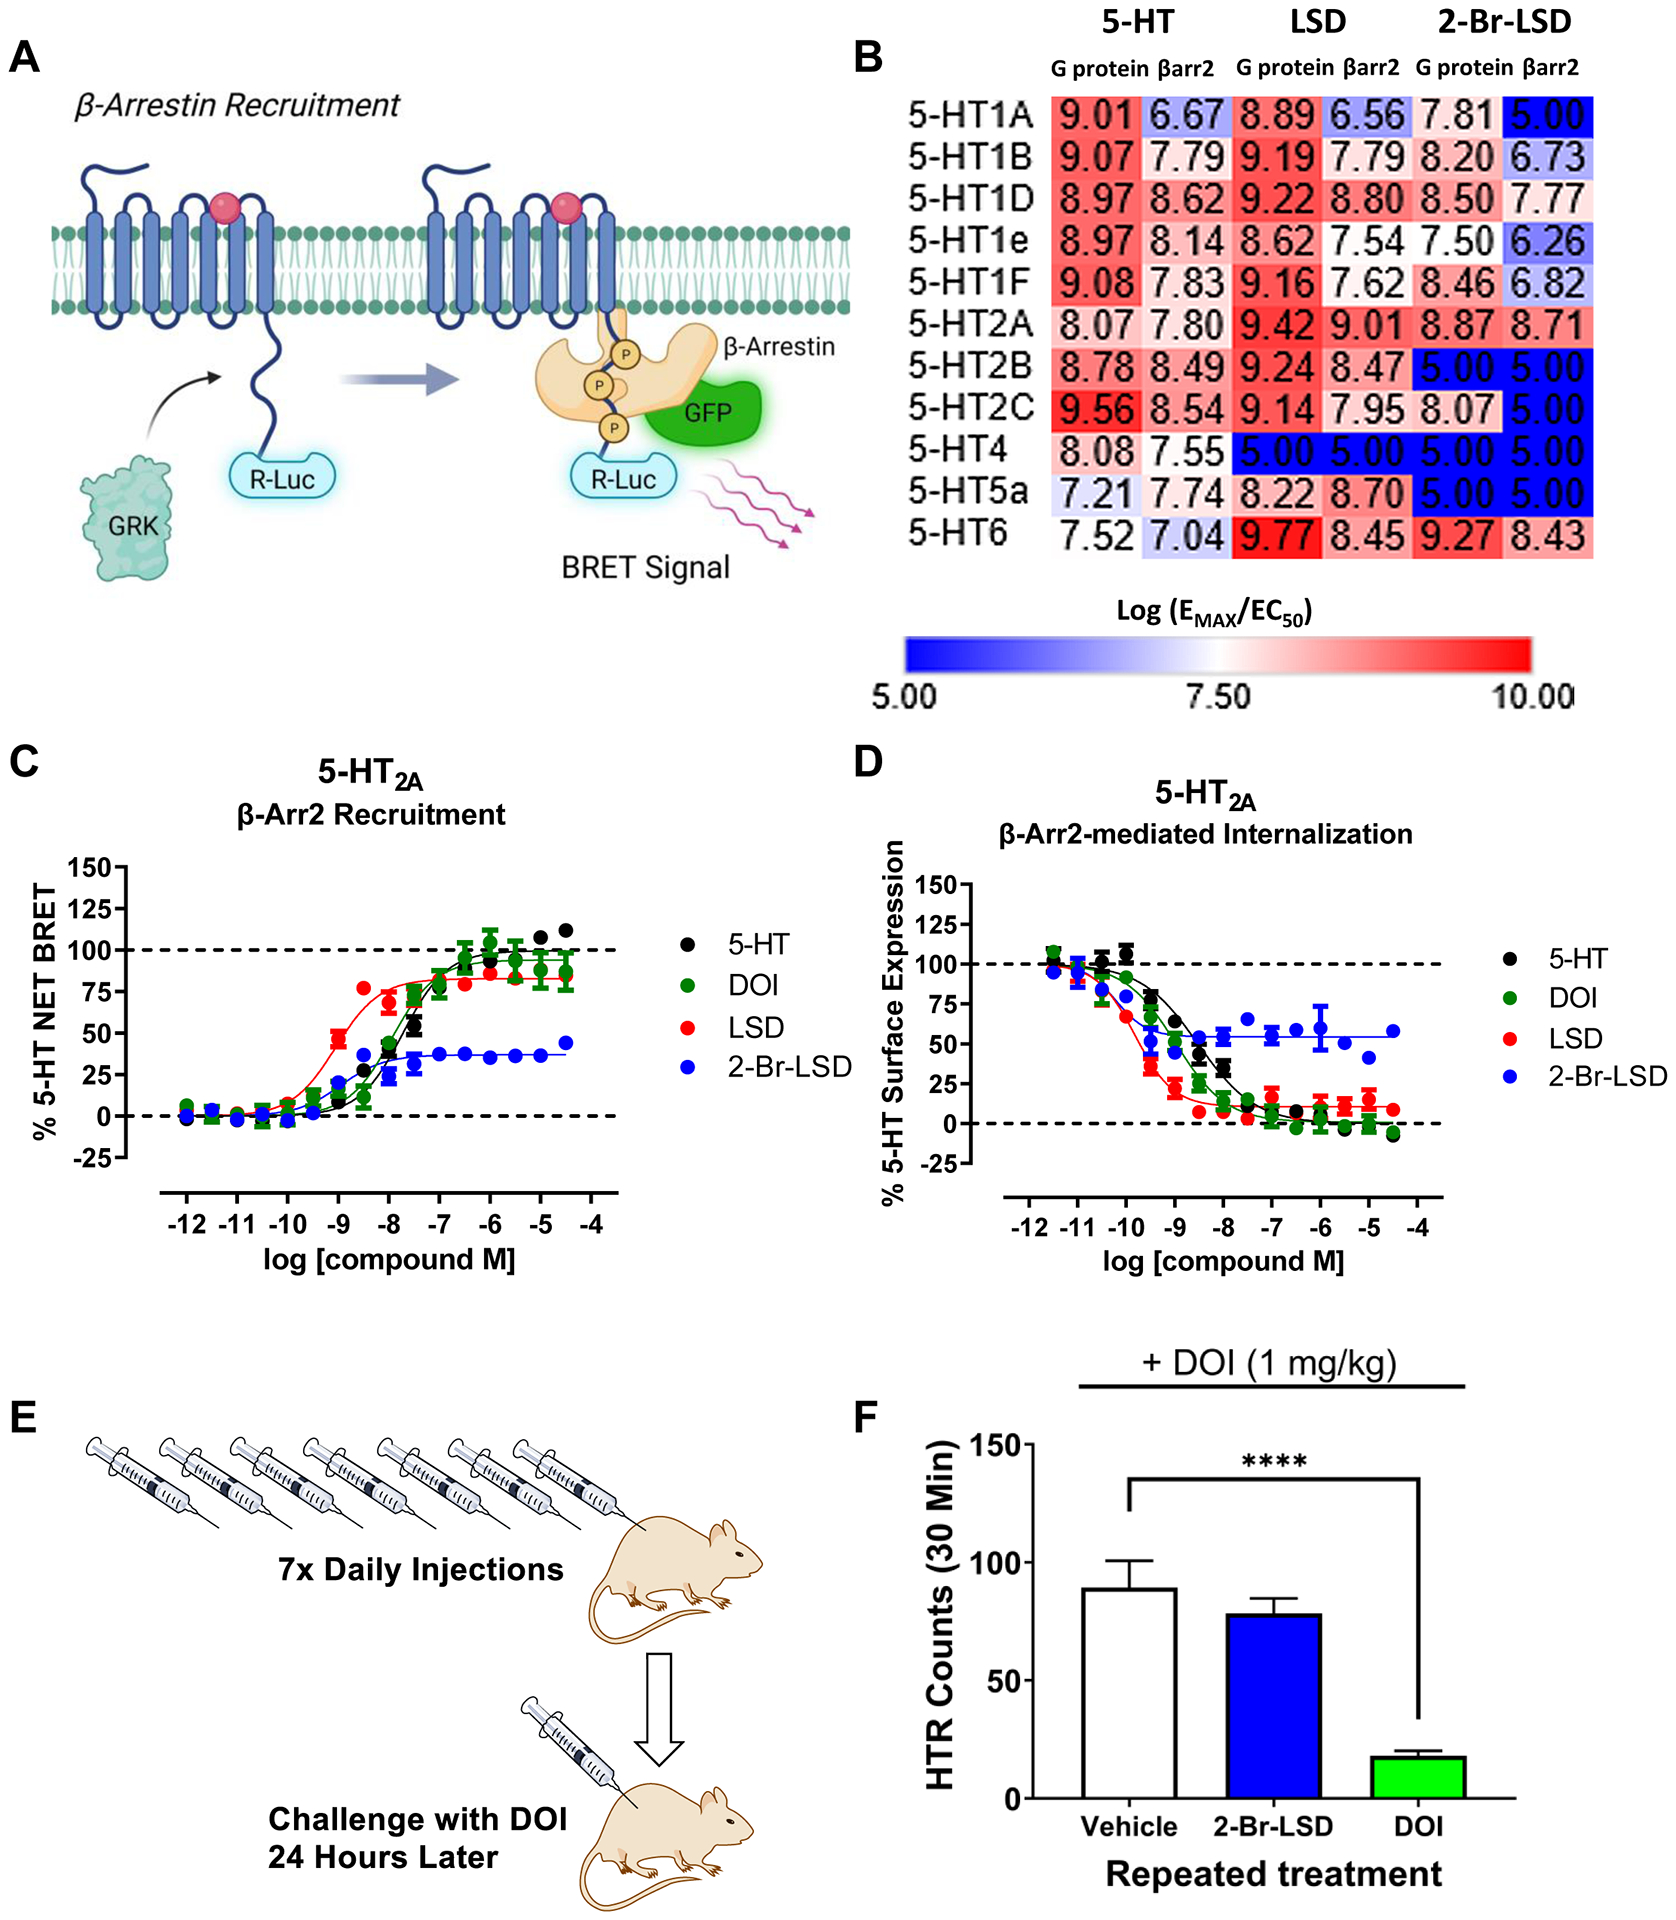
Figure 4. 2-Br-LSD produces weak 5-HT2A β-arrestin recruitment and has reduced potential to induce tolerance in vivo.

(A) 5-HT-ome β-arrestin2 recruitment BRET assay schematic. (B) Heat map showing relative activity (log(EMAX/EC50) comparing 2-Br-LSD to LSD and 5-HT. (C) Graphs of β-arrestin2 recruitment of 2-Br-LSD (blue) to LSD (red), DOI (green) and 5-HT (black) as measured in the β-arr2 recruitment BRET assay. (D) Graphs of loss of surface expression of 2-Br-LSD (blue) to LSD (red), DOI (green) and 5-HT (black) as measured in NanoBit internalization assay. Data represent mean ± SEM from at least n=3 independent experiments performed in triplicate normalized to percent 5-HT response. (E,F) Lack of tolerance to a 5-HT2A agonist after repeated treatment with 2-Br-LSD. Mice were injected IP once per day with vehicle (n=7), 2-Br-LSD (3 mg/kg, n=7), or DOI (10 mg/kg, n=7) for 7 consecutive days and then challenged with DOI (1 mg/kg IP) 24 hours after the last injection. Data are presented as group means ± SEM over the entire 30-minute test session. ****p<0.0001, significant difference between groups (Dunnett’s test). Related to Fig. S4.
