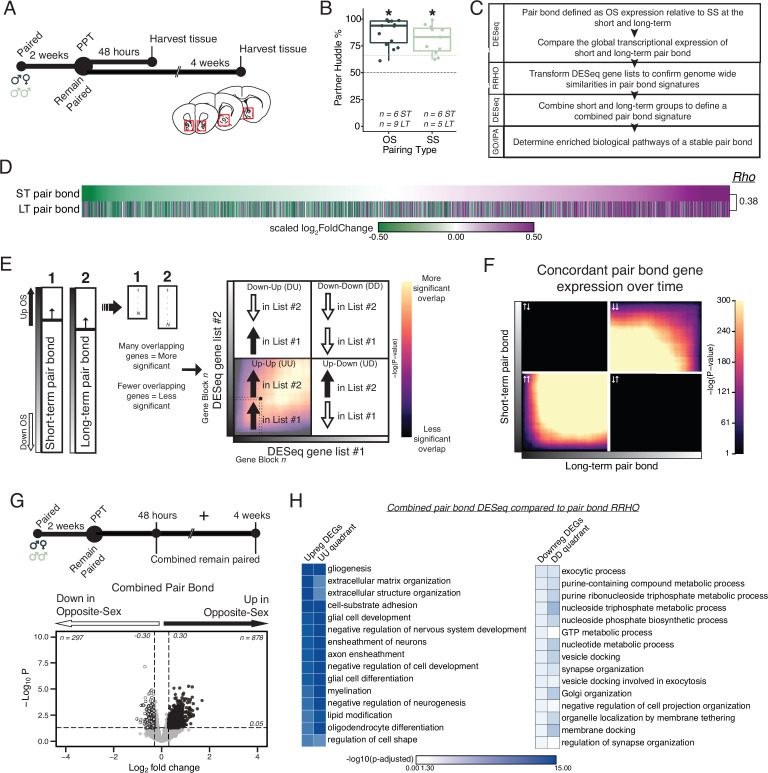
Figure 2. Pair bonding leads to persistent and consistent changes in NAc transcription.
(A) Opposite- and same-sex pairs were paired for 2 weeks prior to a baseline partner preference test. Pairs then remain paired for either 48 hours (short-term; ~2 weeks total pairing) or 4 weeks (long-term; ~6 weeks total pairing) prior to collecting fresh nucleus accumbens tissue (dissection sites in red boxes) for RNA sequencing. (B) Baseline partner preference scores of males included in RNA sequencing for the opposite- and same-sex groups (one-tailed t-test relative to 50%: opposite-sex T14=11.76, p=1.21 X 10⁻⁸; same-sex T10=7.78, p=1.50 X 10⁻⁵). Black dotted line indicates a 50% partner preference score and the grey dotted line indicates 66%. There were no differences in partner preference score between opposite- and same-sex paired animals used for RNAseq (two-tailed t-test: T21.016 = 1.374, p=0.184). (C) Transcriptional analysis workflow. (D) Gene list from both timepoints ordered from the smallest to largest log2FoldChange after short-term pairing with color indicating up- or down-regulation in opposite- vs same-sex pairs. Expression patterns are strongly correlated across timepoints (Rho = 0.38, p=2.2 X 10⁻¹⁶). (E) Schematic of RRHO analysis. The heatmap is arranged into quadrants of genes upregulated in both lists (up-up: quadrant UU), downregulated in both lists (down-down: quadrant DD), or genes that have opposite regulation (up in list 1-down in list 2: quadrant UD; down in list 1-up in list 2: quadrant DU). Genes that are found in both lists at a similar ranked position result in higher p-values and are represented by a yellow color. (F) RRHO comparing short-term and long-term pair bonding (from 2D) indicates a stable pair bond gene signature over time as evidenced by concordant up- or downregulated genes at the two timepoints. (G) The short-term and long-term time points were pooled for opposite- and same-sex pairs to define the combined pair bond gene signature. (H) We compared GO analysis Mus musculus ontology terms between the combined pair bond DEGs and the RRHO quadrants (from 2 F) with strong correspondence between the two analyses.


