. 2023 Feb 28;12:e80517. doi: 10.7554/eLife.80517

Figure 3. Prolonged separation erodes pair bond transcriptional signatures.

(A) Opposite-sex and same-sex pairs were paired for 2 weeks prior to a baseline partner preference test. Pairs were then separated for either 48 hours (short-term) or 4 weeks (long-term) prior to collecting fresh nucleus accumbens tissue for RNAseq. Animals in the Remain Paired group are analyzed in Figure 2 to define the Combined Pair Bond transcriptional signature. (B) Baseline partner preference scores of males included in RNA sequencing for the opposite- and same-sex separation groups (one-tailed t-test relative to 50%: opposite-sex T11=11.56, p=1.71 X 10⁻⁷; same-sex T9=6.07, p=1.87 X 10⁻⁴). Black dotted line indicates a 50% partner preference score and the grey dotted line indicates 66%. There were no differences in partner preference score between opposite-sex and same-sex separated animals used for RNAseq (two-tailed t-test: T14.33 = 0.33, p=0.75). (C) Transcriptional analysis workflow similar to Figure 2. (D) Heatmap of the scaled log2FoldChange for every gene where short- and long-term separation is compared to the combined pair bond gene signature. (E) RRHO using the combined pair bond, short-term separated, and long-term separated ranked transcript lists show that short-term separated animals retain a gene expression pattern concordant with pair bond transcription while there is a dramatic erosion of pair bond gene expression following long-term separation. (F, G) Upset plot showing overlap of genes in the UU or DD quadrants of 2F and 3E RRHO was determined using a Fisher’s Exact test. The difference between the intersections of the pair-bond:short-term sep. and pair-bond:long-term sep. was used to define the eroded gene lists. (H, I) The RRHO gene lists of eroded pair bond genes were used to filter the DESeq heatmap in 2D. Eroded genes from the UU quadrants show upregulation during pair bonding and short-term separation but downregulation after long-term separation (H) while the eroded genes from the DD quadrants show the opposite pattern (I). (J, K) GO and IPA analysis of RRHO quadrant gene lists and pair bond eroded gene lists. Scale represents the –log10(p-adjusted) where any non-significant terms are white. (J) Glial associated GO terms of the UU quadrants are less significantly represented after separation and are highly significantly represented among the eroded genes. Significant upstream regulators of the eroded genes include Sox2, estrogen receptor, Erbb3, and Ctnnb1. (K) Vesicle docking and synapse organization associated GO terms of the DD quadrants are less significantly represented after separation and are more significantly represented among the pair bond eroded genes. Significant upstream regulators of the eroded genes include Hnf4a, Calmodulin, Hdac4, and Adora2a.

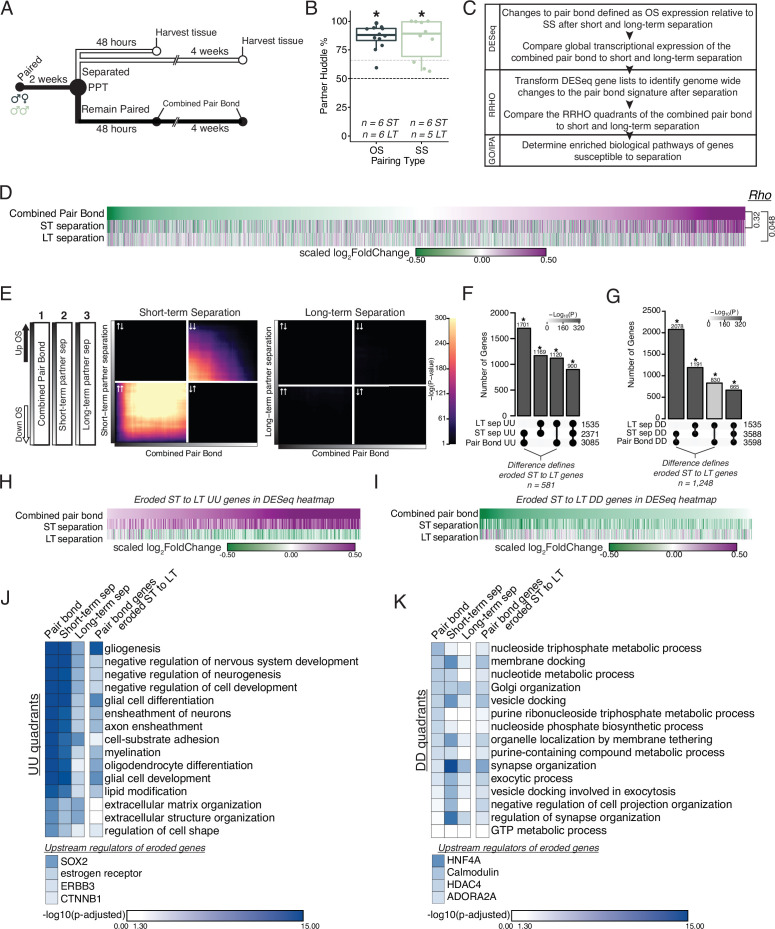
Figure 3.

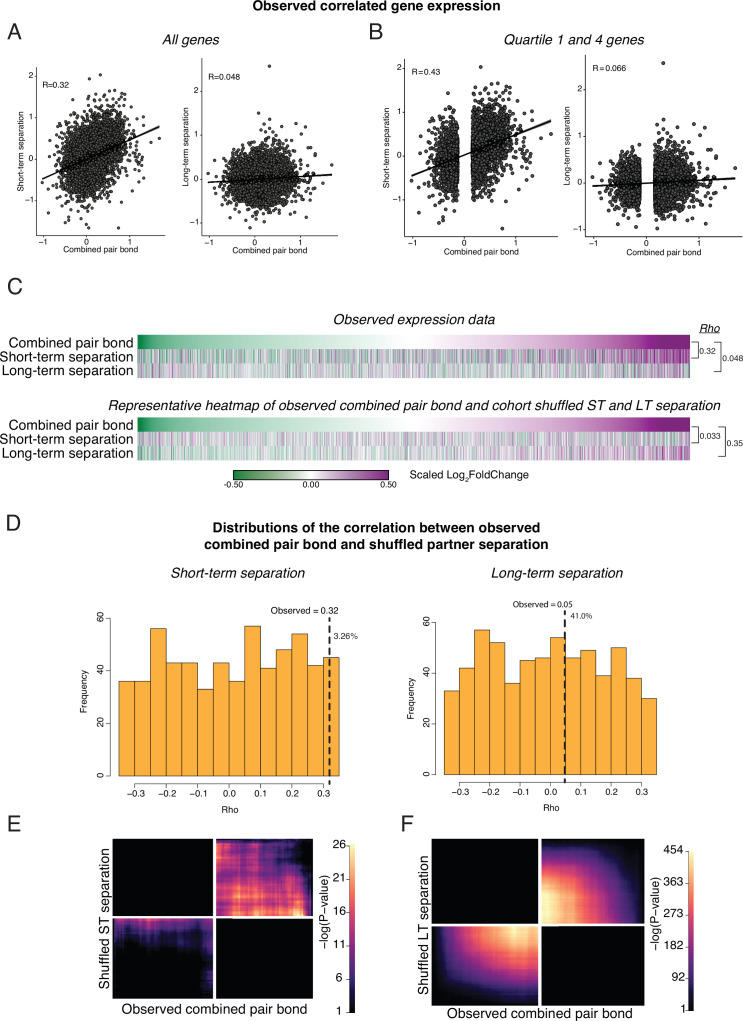
Figure 3—figure supplement 1. Cohort shuffled controls for the combined pair bond and separation time points.

Figure 3—figure supplement 1.

(A) Spearman’s Ranked Correlation of gene expression (log2FoldChange) for the combined pair bond vs short-term separation (left) or the combined pair bond vs long-term separation (right). Black line is the regression line with shading indicating a 95% confidence interval. (B) To ensure that our correlations are not driven by consistent but low differential expression values we only retained the first and fourth quartile of genes in the combined pair bond. We then performed a Spearman’s Ranked Correlation between the combined pair bond and each separation time point and found a greater Rho value for each time point. (C) To test if the correlation in gene expression between timepoints could occur by chance, we shuffled the Cohort identity for each animal and performed differential expression analysis. Heatmaps show every gene from the combined pair bond and separation time points ordered from the smallest to largest log2FoldChange in the combined pair bond for the observed comparison (top) and a representative Cohort shuffle (bottom) with Rho values for each. Scale represents the scaled log2FoldChange. (D) Histogram of Rho values for a 1000 shuffles of the Cohort identity as in C, shuffled. Rho values for the correlation between the combined pair bond vs short-term separation (left) or the combined pair bond vs long-term separation (right) are plotted for each iteration. Only correlations that did not have a –log10(adjusted pvalue) of infinite were retained (short-term separation n = 613; long-term separation n = 617). Vertical dashed line indicates the observed Rho value with the percent of shuffled Rho’s that were greater than the observed value to the right (pair bond:short term 3.26%; pair bond:long term 41%). (E, F) Unscaled RRHO plot of the representative Cohort shuffle used in (C). The combined pair bond vs short-term separation (E) indicates a similar concordant pattern as the observed data though to a much lower degree (note scale maximum). The combined pair bond vs long-term separation (F) shows a highly significant concordant pattern that does not occur in the observed data.
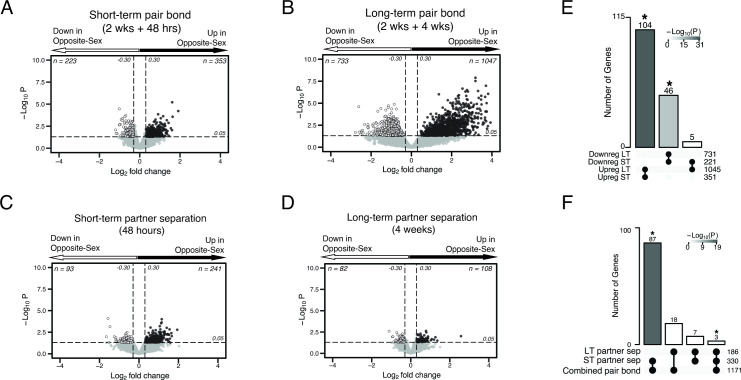
Figure 3—figure supplement 2. Volcano plots of differential expression with Upset plots for overlap of differential expressed genes.

Figure 3—figure supplement 2.

Figure is also supplemental data for Figure 2. (A–D) Volcano plots with associated Upset plots of the differentially expressed genes of the short-term pair bond (A), long-term pair bond (B), short-term partner separation (C), and long-term partner separation (D). Genes that are upregulated in opposite-sex paired males compared to same-sex paired males are to the right (black dots) and genes that are downregulated are to the left (white dots). Dashed lines indicate thresholds of +/-0.30 log2FoldChange (vertical) or 0.05 p-value (horizontal) used to determine differential expression. (E) Upset plot showing overlap of up- and downregulated DEGs from each timepoint. Intersections with no overlapping genes, such as downregulated long-term:upregulated short-term, are not displayed on the graph. Asterisks and shading indicate statistically significant intersections (Fisher’s Exact Test: Upreg ST:LT χ2=30.24, p=5.36 X 10⁻³¹; Downreg ST:LT χ2=13.32, p=7.05 X 10⁻¹⁴). (F) Upset plot showing the combined up- and downregulated separation DEGs compared to the combined pair bond DEGs. There are more shared transcripts between the pair bond and short-term separated animals than the pair bond and long-term separated animals. Asterisks and shading indicate statistically significant intersections (Fisher’s exact test: pair-bond:short-term sep χ2=31.86, p=6.78 X 10⁻¹⁹; pair-bond:long-term sep χ2=17.96, p=0.53).
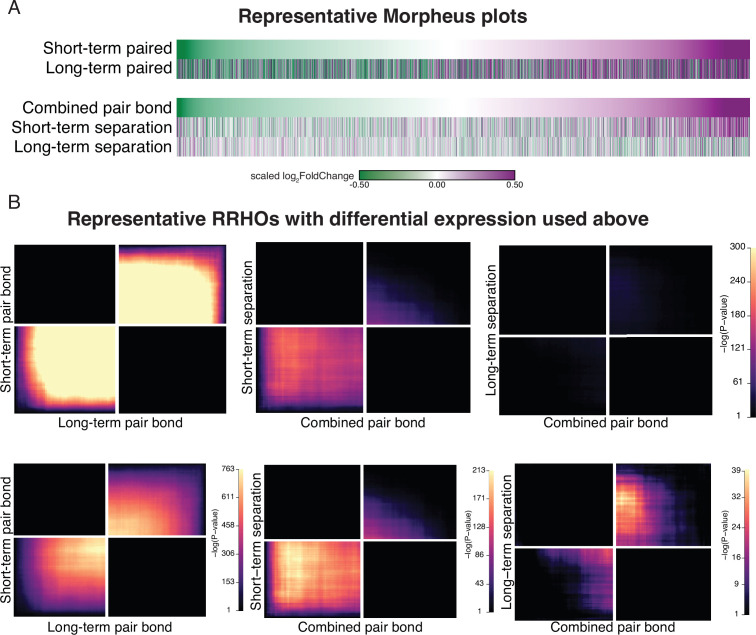
Figure 3—figure supplement 3. Randomly selected subsampled data shows the same differential expression and RRHO patterns as the full dataset.

Figure 3—figure supplement 3.

(A) We selected a random subset of the same number of animals for each opposite-sex (n=6) and same-sex paired (n=5) cohort, and performed differential expression analysis between pairing time points (top) and the combined pair bond vs separation time points (bottom). The heatmap shows genes ordered based on log2FoldChange in the short term Pair bond (tope) or combined pair bond (bottom) with color indicated expression difference between opposite and same-sex paired males. Scale represents the scaled log2FoldChange. (B) RRHO heatmaps of the representative subset used in (A) that use the same scale as the observed data (top) or are unscaled to visually optimize significant signal (bottom).
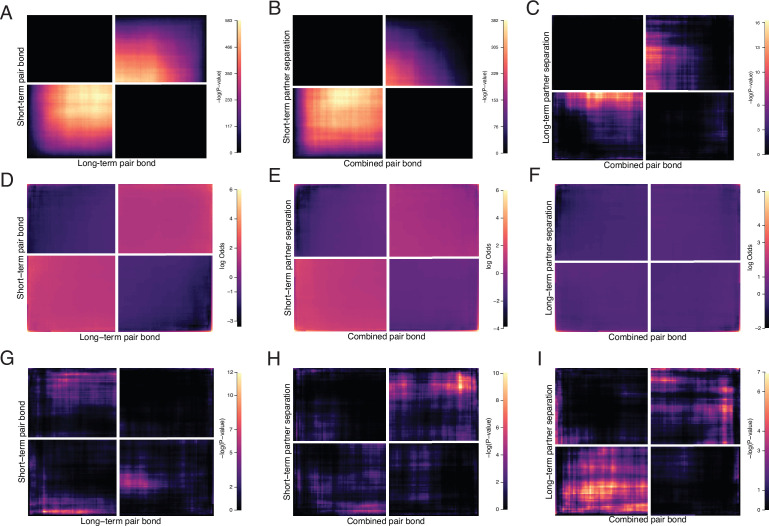
Figure 3—figure supplement 4. Control analyses for RRHO.

Figure 3—figure supplement 4.

Further examination of RRHO results where A, D, G correspond to Figure 2F (short-term vs long-term remain paired). B, E, F correspond to Figure 3E left (pair bond vs short-term separation). C, F, I correspond to Figure 3E right (pair bond vs long-term separation). (A, B, C) RRHOs showing -log10(p-value) scales optimized for visualization of significant signal. Note the greatly reduced scale (max 16) in C compared with other analyses. (D, E, F) Log-Odds ratio plots for RRHOs of all analyses scaled to a max value of 6. (G–I) Control analyses where the ranked gene lists were randomly shuffled while all other RRHO parameters remain the same.
Figure 3—figure supplement 5. RRHO of short-term vs long-term partner separation reveals a transcriptional signature of partner loss.

Figure 3—figure supplement 5.

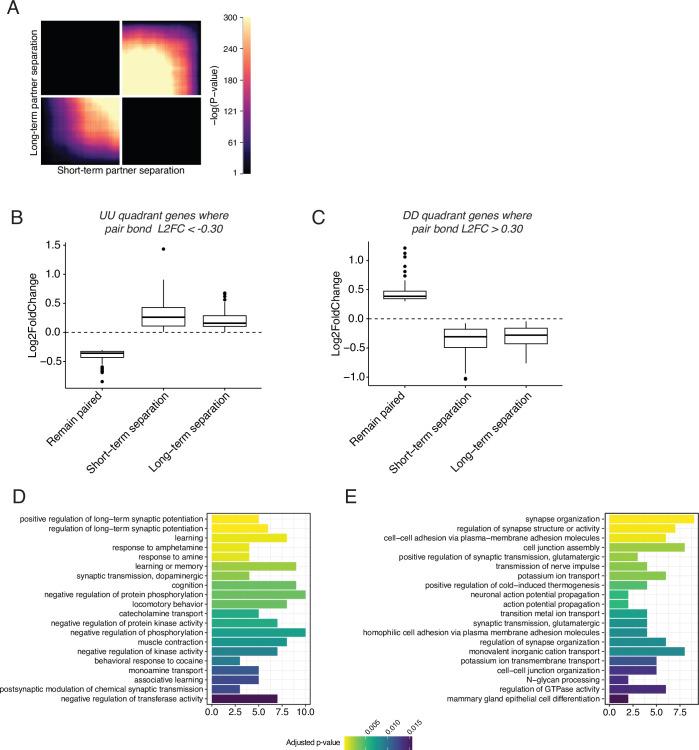
(A) RRHO comparing short-term and long-term partner loss. Heatmap indicates that genes that are downregulated after short-term separation remain downregulated after long-term partner separation. (B, C) Gene lists were extracted from the UU and DD quadrants and used to filter the combined pair bond differential expression data of Figure 2. (B) The UU quadrant genes that had a L2FC <–0.30 in the combined pair bond were plotted for their expression in males that stayed with their partner or were separated for 48 hours or 4 weeks. (C) The DD quadrant genes that had a L2FC >0.30 in the combined pair bond were plotted for their expression in males that stayed with their partner or were separated for 48 hr or 4 weeks. (D, E) GO analysis using Mus musculus ontology terms for the UU quadrant filtered genes used in B (D) or the DD quadrant filtered genes used in C (E).