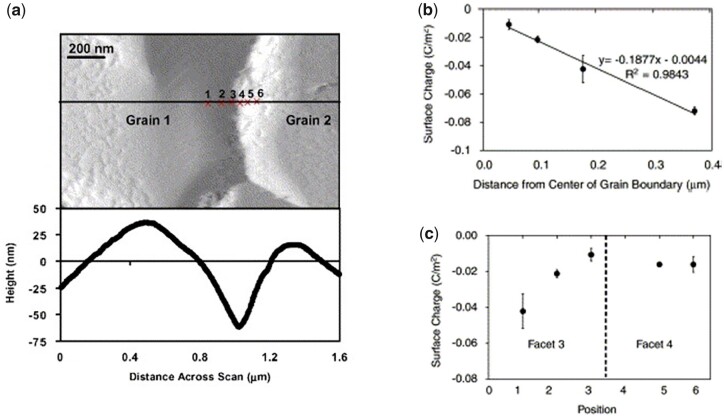
Figure 16.
Surface charge and roughness across HA surfaces. (a) Contact mode atomic force microscopy deflection image using a COO− terminated probe tip in fluid. The plot below shows the height profile along the solid black line in the image. (b) Approximation of surface charge per unit area from HRFS data fitted at each specific probe position presented in (a). (c) Linear regression of Poisson–Boltzmann fitted HRFS data showing surface charge with increasing distance from the Centre of the grain boundary. Adapted and reproduced from Ref. [178]. Copyright ©2004, Elsevier Ltd.

