Figure 19.

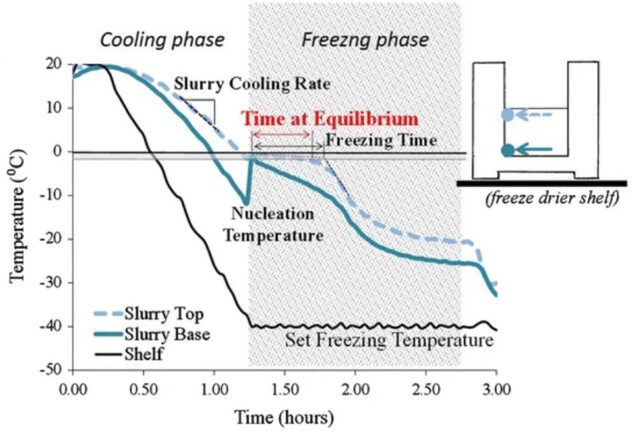
Schematic showing the temperature profile of a freezing shelf inducing characteristic temperature profiles at the top and base of a collagen slurry during freeze-drying. Obtained from Ref. [200].

Schematic showing the temperature profile of a freezing shelf inducing characteristic temperature profiles at the top and base of a collagen slurry during freeze-drying. Obtained from Ref. [200].