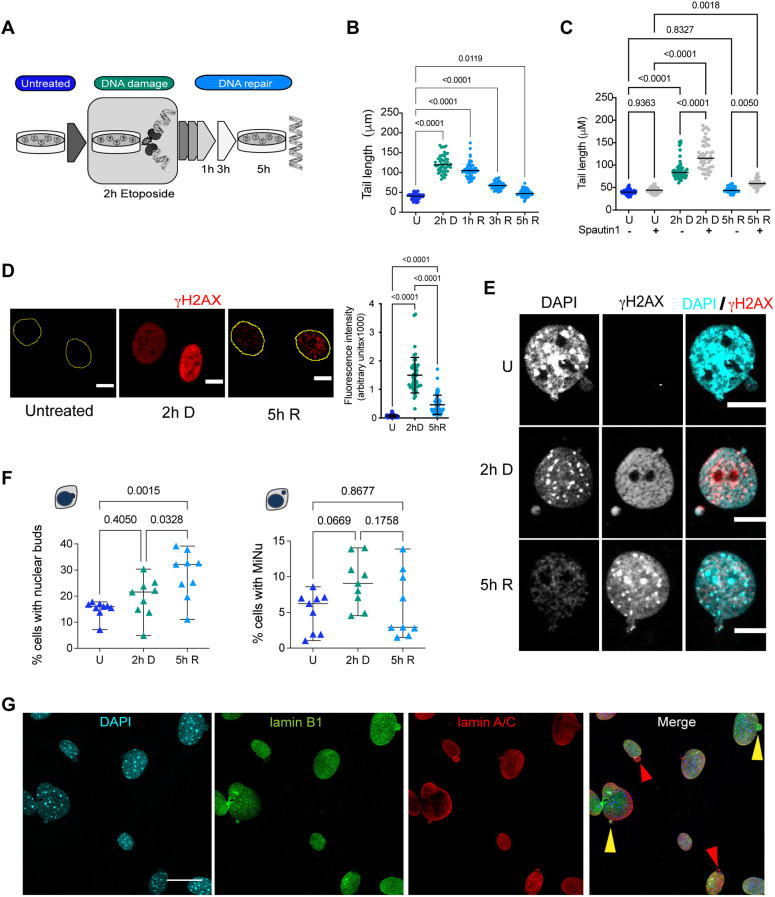
Fig. 1.
There is a basal formation of nuclear buds and micronuclei in primary fibroblasts, which increases with etoposide-mediated induction of DSBs. (A) Workflow for the DNA damage and repair assay. MEFs were exposed to 120 µM etoposide for 2 h to damage DNA (2 h D), then etoposide was removed to allow DNA repair, which was monitored after 1, 3 or 5 h. (B) Quantification of comet tail length (which is proportional to the number of DSBs) in untreated cells (U), after 2 h of etoposide exposure (2 h D), and after 1 h, 3 h or 5 h of etoposide removal (1 h R, 3 h R, 5 h R, respectively). Bars represent median at each time point, statistical significant differences were determined by one-way ANOVA followed by Dunnett's multiple comparison test; adjusted P-value is indicated for each comparison. 50 comets were measured in each of three independent experiments. Detailed data are shown in Table S1. (C) Quantification of comet tail length in untreated cells (U), after 2 h of etoposide exposure (2 h D), and 5 h of etoposide removal (5 h R), previously treated for 12 h with vehicle (−) or 10 µM Spautin1 (+). Bars represent median at each time point, statistical significant differences were determined by one-way ANOVA followed by Dunnett's multiple comparison test; adjusted P-value is indicated for each comparison. 50 comets were measured in each of three independent experiments. Detailed data are shown in Table S1. (D) DDR followed by the recruitment of γH2AX in untreated (U), damaged (2 h D) or repaired (5 h R) DNA. Yellow contours indicate the nuclei of cells. Scale bars: 10 µm. The fluorescence signal was quantified in 48 cells per experiment in three independent experiments and the mean±s.d. is graphed to the right. Statistical significant difference was determined by One-way ANOVA followed by Tukey′s multiple comparison test; adjusted P-value is indicated for each comparison. Detailed data are shown in Table S1. (E) Nuclear buds or independent micronuclei were observed by confocal microscopy in untreated (U), damaged (2 h D) or repaired (5 h R) DNA. DNA damaged marked with γH2AX (red) was found in both buds and micronuclei, mainly when cells were treated with etoposide. DNA was stained with DAPI. Scale bars: 10 µm. (F) Quantification of the percentage of cells with nuclear buds or micronuclei (MiNu) in untreated (U), damaged (2 h D) or repaired (5 h R) DNA. The mean±s.d. of nine independent experiments is graphed. Statistical significant difference was determined by one-way ANOVA followed by Dunnett's multiple comparison test; adjusted P-value is indicated for each comparison. For every experiment (represented as triangles) at least 50 cells were counted; detailed data are shown in Table S1. (G) Representative immunofluorescence images from five independent experiments to detect lamin A/C (red) and lamin B1 (green) in MEFs treated with etoposide for 2 h (2 h D). Yellow arrowheads show examples of buds containing both lamin A/C and lamin B1. Red arrowheads show examples of buds containing only lamin A/C. Scale bar: 30 µm.

