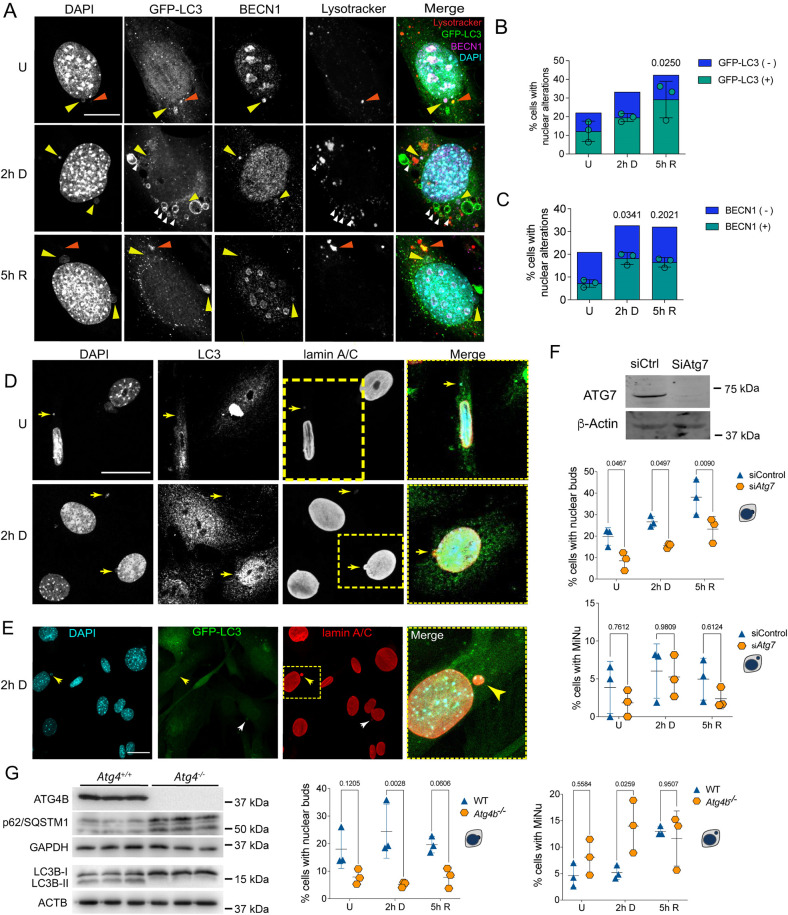
Fig. 2.
Nuclear buds and micronuclei are associated with components of different stages of the autophagic pathway. (A) Representative images of autophagic proteins GFP–LC3 and BECN1 found in nuclear buds (yellow arrowhead) in MEFs that were untreated (U), treated for 2 h with etoposide (2 h D) or after 5 h of DNA repair (5 h R), as used for quantifications shown in B and C. Some micronuclei were contained in autolysosomes, identified by having DNA (DAPI), GFP–LC3 and Lysotracker® staining (orange arrowheads). GFP–LC3-labeled vesicles next to Lysotracker® staining, or with Lysotracker® staining inside, are shown with white arrowheads. Scale bar: 10 µm. (B,C) Percentage of cells with nuclear alterations (nuclear buds and micronuclei). Among nuclear alterations, those containing GFP–LC3 (B) or BECN1 (C) are shown in green, whereas those without GFP–LC3 or BECN1 are shown in blue. Color bars represent the mean of three independent experiments. Green symbols represent the percentage of cells with nuclear alterations containing GFP–LC3 or BECN1; bars represent mean±s.d. The percentage of cells with nuclear buds or micronuclei are shown independently in Fig. S3. At least 50 cells were counted per treatment and experiment, and significant differences were determined by one-way ANOVA followed by a Kruskal–Wallis test; P-value is indicated in comparison with untreated samples. (D) Representative images of endogenous LC3B localized in micronuclei surrounded by lamin A/C, and containing DNA detected by DAPI staining (yellow arrows) in MEFs untreated (U) or treated for 2 h with etoposide (2 h D). Yellow squares indicate the magnified areas shown to the right. Scale bar: 30 μm. (E) Representative micronuclei surrounded by lamin A/C containing GFP–LC3 (yellow arrows) in MEFs treated for 2 h with etoposide. Yellow dotted square indicates the magnified area shown to the right. Scale bar: 30 µm. Images in D and E are representative of five repeats. (F) Functional autophagy seems to be necessary to form nuclear buds. MEFs were transfected with siRNA control (siCtrl) or siAtg7 for 48 h and then treated or not with etoposide for 2 h and left to repair DNA for 5 h [untreated (U), damaged (2 h D) or repaired (5 h R) DNA]. The western blot shows representative level of Atg7 silencing; β-actin was used as loading control. Whole blots are shown in Fig. S4A. Graphs show the percentage of cells with nuclear buds (top) or micronuclei (MiNu; bottom). For every experiment at least 50 cells were counted by detecting DAPI signal in nuclear alterations in confocal images. The distribution of the data from three independent experiments is graphed (mean±s.d.). Significant differences were obtained by two-way ANOVA analysis, followed by a Sidak's multiple comparison test. Adjusted P-values are indicated for each comparison. (G) Functional autophagy seems to be necessary for micronuclei elimination. WT and Atg4b−/− MEFs were analyzed to evaluate the abundance of nuclear alterations. Western blot demonstrates lack of ATG4B in Atg4b−/− MEFs, accompanied by an accumulation of p62/SQSTM1 protein and absence of LC3B lipidation (lack of LC3B-II), confirming deficient autophagosome formation. The indicated sizes correspond to the molecular mass markers used for each blot. Whole blots are shown in Fig. S4B. Graphs show the percentage of cells with nuclear buds (left) or micronuclei (right). For every experiment at least 140 cells were counted by detecting the DAPI signal in nuclear alterations in confocal images. The distribution of the data from three independent experiments is graphed (mean±s.d.). Significant differences were analyzed by two-way ANOVA following a Sidak's multiple comparison test; P-value is shown for each comparison. Detailed data of every graph are shown in Table S1.

