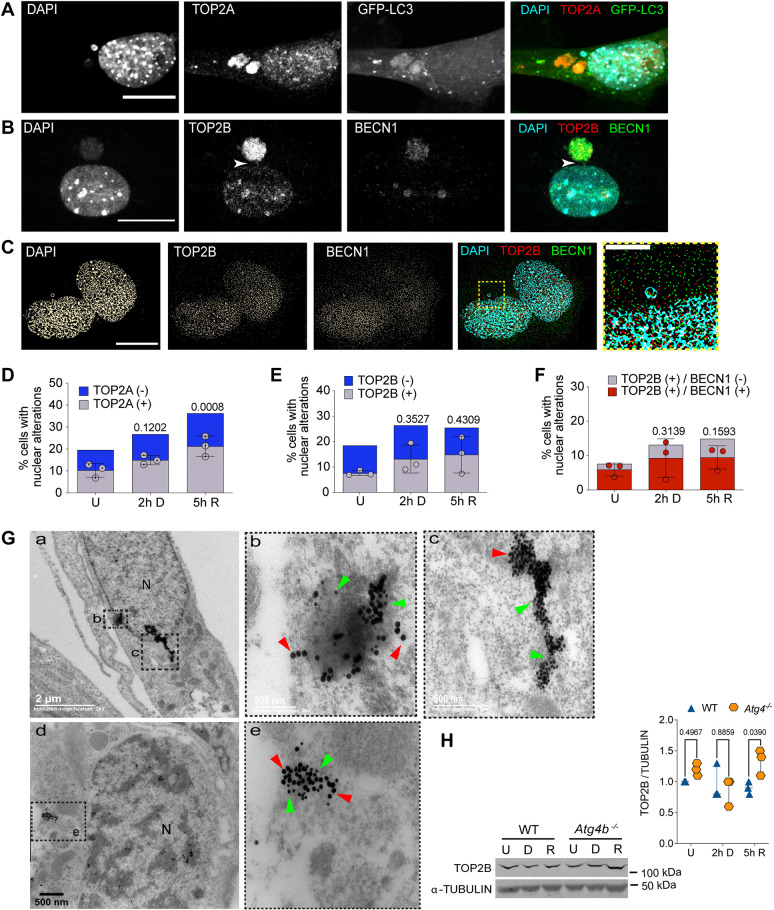
Fig. 3.
TOP2cc are targeted for nucleophagic clearance. (A) Representative confocal image after immunofluorescence staining to detect TOP2A in MEFs expressing GFP–LC3, treated with 120 µM etoposide for 2 h. Scale bar: 20 µm. (B) Representative confocal image after immunofluorescence staining to detect TOP2B and BECN1 in MEFs treated with 120 µM etoposide for 2 h. Scale bar: 20 µm. Arrowheads show a bridge contacting both the main nucleus and a micronucleus containing both TOP2B and BECN1 signals. (C) Representative images obtained by super-resolution microscopy to detect colocalization of DNA and TOP2B (TOP2Bcc) with BECN1 in MEFs after 5 h of DNA repair. Yellow square represents the magnified section presented to the right. Scale bar: 15 µm; magnified section, 5 µm. Images in A–C are representative of three repeats. (D) Percentage of untreated (U), DNA damaged (2 h D) or DNA repaired (5 h R) cells with nuclear alterations (nuclear buds and micronuclei) containing DNA and TOP2A (gray bars). Nuclear alterations without TOP2A are shown as blue bars. The mean±s.d. for three independent experiments (counting at least 50 cells per experiment) are graphed. (E,F) Percentage of cells with nuclear alterations (nuclear buds and micronuclei) containing TOP2B (in E) or TOP2B colocalizing with BECN1 (in F) in untreated MEFs or after DNA damage (2 h D, cells treated with 120 µM etoposide for 2 h) or DNA repair phase (5 h R, cells after 5 h of etoposide removal). At least 50 cells were counted for each experiment. The mean±s.d. of three independent experiments is graphed. In D–F, statistical significance was calculated by two-way ANOVA followed by Dunnett's multiple comparison test; adjusted P-values are shown for each comparison. (G) Electron micrographs showing simultaneous detection of LC3B and TOP2B by immunogold labeling. Figures b and c show higher magnification views of the area indicated in a; e shows a higher magnification views of the area indicated in d. Green arrowheads show examples of 15 nm gold particles coupled to secondary antibody to detect TOP2B and red arrowheads point to 25 nm gold particles coupled to secondary antibody to detect LC3B. Images in G are representative of three repeats. (H) Western blot of total extracts from WT or Atg4b−/− MEFs that were untreated (U), treated for 2 h with etoposide (D) or after 5 h of DNA repair (R) to compare the abundance of TOP2B in the presence (WT) or absence of ATG4 (Atg4b−/−). α-Tubulin was detected as a loading control. Whole blots are presented in Fig. S4. Graph shows a densitometric analysis of three independent experiments. Statistical significance was determined by two-way ANOVA followed by Sidak's multiple comparisons test. Adjusted P-values are shown for each comparison.

