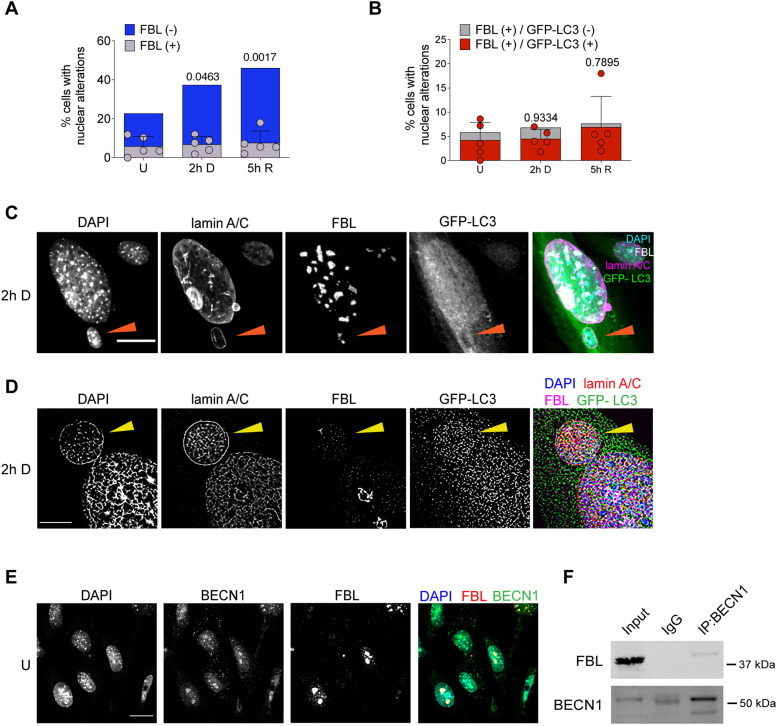
Fig. 4.
The nucleolar protein fibrillarin is found in nuclear buds and micronuclei containing autophagic proteins. (A) Percentage of cells containing nuclear alterations (buds and micronuclei), with (gray bars) or without (blue bars) fibrillarin (FBL) in untreated cells (U), or after etoposide treatment (2 h D) or after 5 h of DNA repair (5 h R). (B) Percentage of cells containing nuclear alterations (buds and micronuclei), with (gray bars) or without (red bars) FBL and GFP–LC3 in untreated cells (U), or after etoposide treatment (2 h D) or after 5 h of DNA repair (5 h R). For A and B, dots represent the mean of each experiment (n=5); at least 50 cells were counted per experiment by analyzing DAPI distribution in confocal images. Bars correspond to s.d. A two-way-ANOVA followed by Dunnett′s multiple comparison test of the total number of nuclear alterations. Adjusted P-values are indicated for each comparison with control cells. Even though there is a trend to increase nuclear alterations containing fibrillarin upon DNA damage, no statistical significant differences were obtained. Detailed data are presented in Table S1. (C) Representative confocal microscopy images showing fibrillarin (FBL) in a micronucleus containing DNA stained with DAPI and surrounded by lamin A/C (arrowhead) and GFP–LC3, in cells treated with etoposide for 2 h. Scale bar: 20 µm. (D) Representative super-resolution microscopy images of the same experiment described in C. Scale bar: 5 µm. (E) Representative confocal microscopy images showing the concurrent distribution of FBL and BECN1 in control cells. Scale bar: 20 µm. (F) Immunoprecipitation (IP) of BECN1, and western blot to detect FBL or BECN1 as indicated, from total protein extract of untreated cells. IgG was used as control of FBL-specific interaction with BECN1. Whole blots are shown in Fig. S4C. Images in C–E are representative of three repeats. Blots in F are representative of two repeats.

