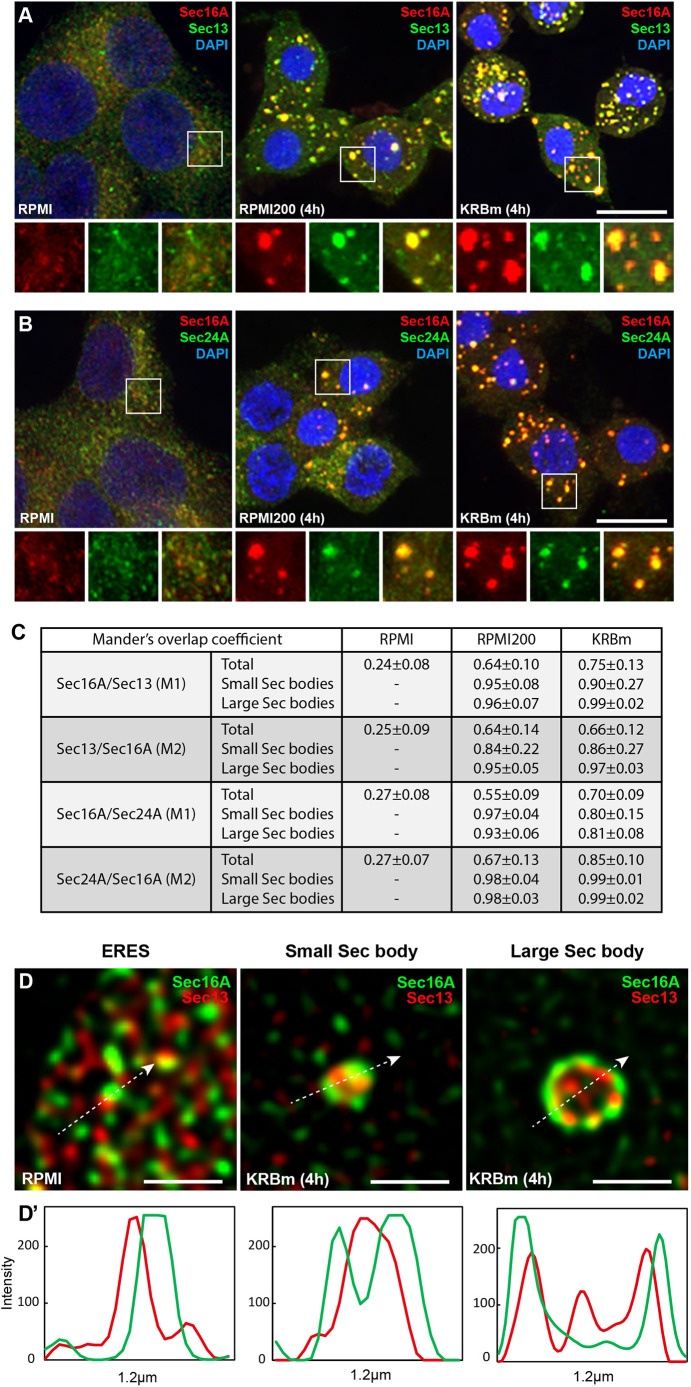
Fig. 2.
Sec16A-positive structures contain COPII subunits. (A,B) IF visualization of endogenous Sec16A and Sec13A (A), and Sec16A and Sec24A (B) in INS-1 cells upon incubation in RPMI, RPMI200 and KRBm (4 h). (C) Quantification of the Mander's overlap coefficient (M1 and M2) for experiments in A and B. Values correspond to the total overlap of proteins per cell, or the overlap per small or large Sec body. N=2 experiments, n=12–37 cells, 32–86 structures per condition, and are given as mean±s.d. (D,D′) Representative super-resolution STED images of ERES, and small and large Sec bodies from cells incubated in KRBm and labeled as in A. Intensity profile line for the arrow shown in D (D′). Notice the shell-like distribution of Sec16A around the COPII protein Sec13 within Sec bodies. See also Fig. S3. Scale bars: 10 μm (A,B), 1 μm (D).

