Fig. 4.
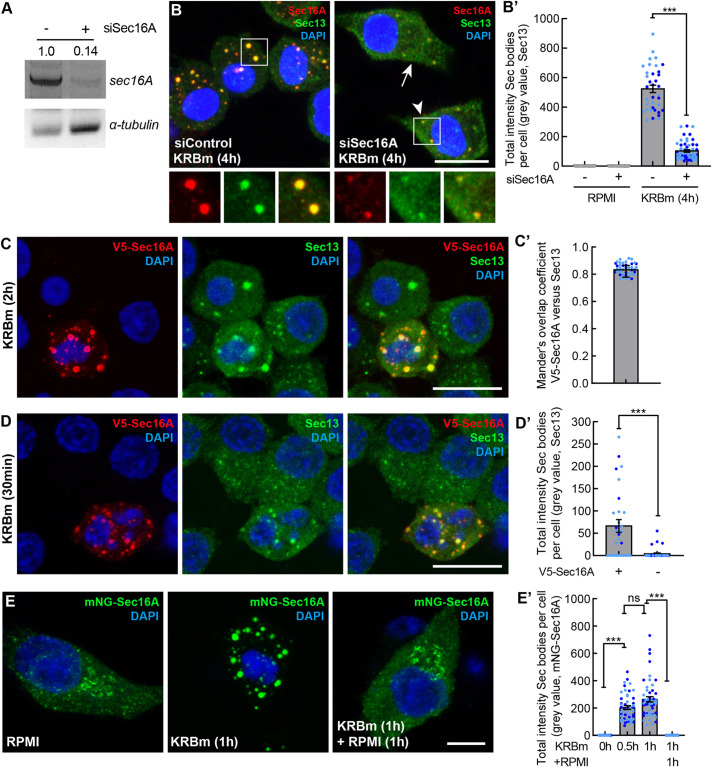
Sec16A drives Sec body formation in INS-1 cells. (A) PCR of Sec16A and α-tubulin cDNAs from mock and Sec16A-depleted (siSec16A) INS-1 cells. Note that depletion of Sec16A for 4 days leads to a very efficient knockdown (86%). Normalized value of Sec16A against α-tubulin, was used to calculate the Sec16A ratio between mock and Sec16A-depleted cells. Results shown are representative for two repeats. (B,B′) IF visualization of Sec16A and Sec13 in Sec16A-depleted INS-1 cells incubated in KRBm for 4 h (B). Arrow, cell with undetectable Sec16A; arrowhead, cell with a small pool of Sec16A. Note that Sec body formation (marked by Sec13) is inhibited upon Sec16A depletion. Quantification of the total intensity of Sec bodies per cell (B′); N=2 experiments, n=36–70 cells. (C,C′) IF visualization of V5–Sec16A (anti V5 and endogenous Sec13 in V5-Sec16A transfected INS-1 cell after KRBm incubation for 2 h (C). Mander's overlap coefficient between V5 and Sec13 in Sec bodies (C′); N=2 experiments, n=40 cells. (D,D′) IF visualization of V5–Sec16A (anti V5) and endogenous Sec13 in V5–Sec16A transfected INS-1 cell after KRBm incubation for 30 min (D). Compare the Sec body formation in transfected versus adjacent non-transfected cells. Quantification of total Sec13-positive Sec body intensity per cell in transfected and non-transfected cells (D′); N=2 experiments, n=29–36 cells. (E,E′) Fluorescence images of INS-1 cells expressing mNeonGreen (mNG)–Sec16A incubated in KRBm for 0, 60 min, and 60 min followed by 1 h further incubation in RPMI (E). Quantification of mNG–Sec16A total intensity of Sec bodies (E′); N=2 experiments, n= 50–51 cells. See also Fig. S4. Scale bars: 10 μm (B–D); 5 μm (E). Error bar are s.d. (C′), s.e.m. (B′,D′,E′). ***P<0.001; ns, not significant (Mann–Whitney test (B′,D′); Kruskal-Wallis test followed by Dunn′s multiple comparisons (E′)).

