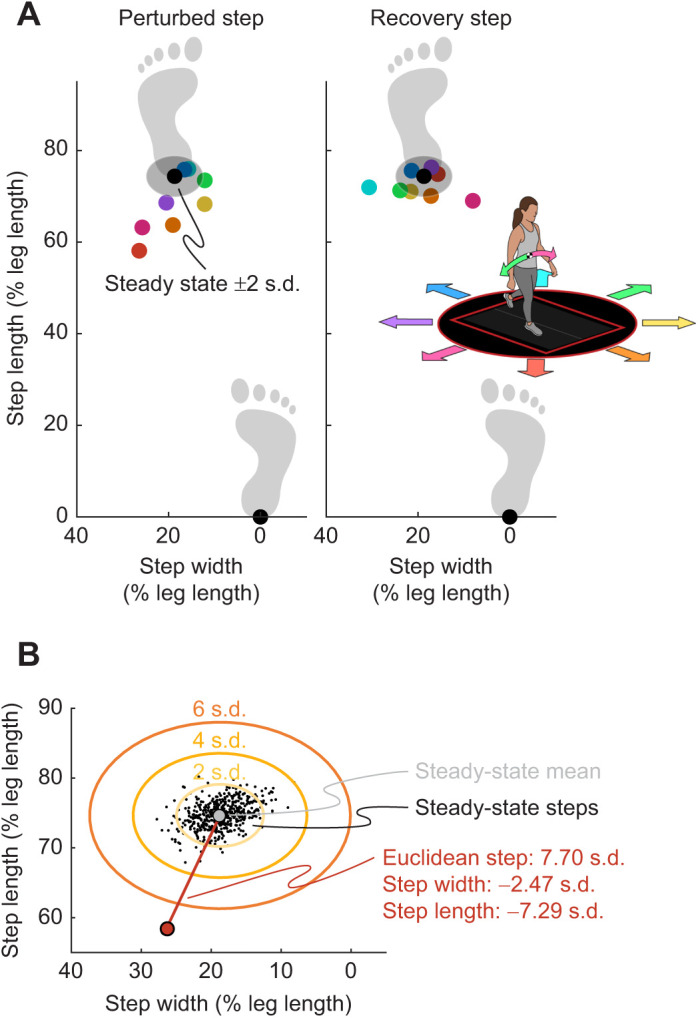
Fig. 3.

Calculating step placement during the perturbed and recovery steps. (A) Step placement during steady-state and perturbed walking across directions for a representative participant. Step placement is normalized by the participant's leg length. The steady-state average and ±2 s.d. are shown by the black point and surrounding shaded region, respectively. Examples of perturbed strides are shown for each direction, with magnitude fixed at 15 cm and timing fixed at early single stance. Each direction is the average step placement for a representative participant across all repetitions of the given condition. Directions are shown by colored points corresponding to the walking arrow diagram in the right panel. The COM pitches in the opposite direction to the platform slide. Generally, the green arrow results in a narrowing step while the pink arrow results in a widening step; the orange arrow pitches the COM backward, while the blue arrow pitches the COM forward. (B) Determining Euclidean step placement. The perturbed steps (example red point) are normalized relative to the steady-state steps (black dots). We first subtract the steady-state mean (light gray point) from the perturbed step and then divide by the standard deviation (2, 4, 6 s.d. shown by orange ovals) of the steady-state steps. This results in a value with units of s.d. and depicts how severely the perturbed and recovery steps deviate relative to steady-state data. Finally, we also calculate the Euclidean deviation of step placement (length of red line between mean and perturbed step) using the normalized step length and width values.
