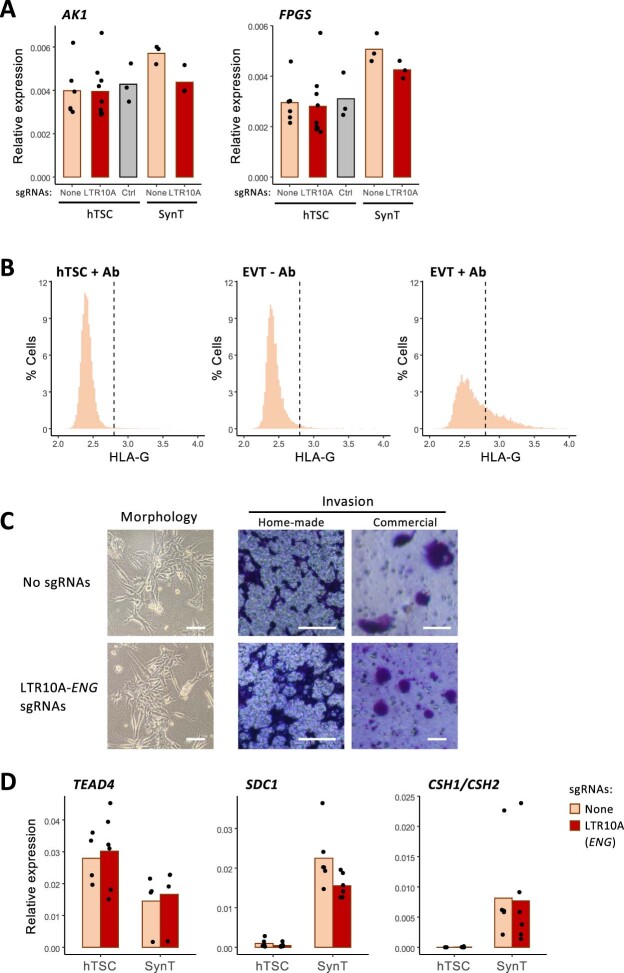
Extended Data Fig. 6. Transcriptional and phenotypic effects of LTR10A-ENG deletion.
A, AK1 and FPGS expression in hTSC or hTSC-derived SynT populations carrying lentiviral CRISPR constructs with no sgRNAs, sgRNAs that excise the LTR10A element highlighted in Fig. 6a, or sgRNAs that excise a control region also highlighted in Fig. 6a. B, Representative FACS profiles for HLAG immunolabelling in hTSCs and hTSC-derived EVTs. The middle panel is a no-antibody control. C, Images of cells in culture (to assess morphology) or crystal violet-stained cells after an invasion assay using Matrigel-coated chambers (either home-made chambers or from a commercial provider). Images representative from six independent experiments. Scale bars are 100 µm. D, Expression of stem cell (TEAD4) and SynT (SDC1, CSH1/CSH2) in cell populations with no sgRNAs or sgRNAs that excise the LTR10A-ENG element. No significant differences were detected in any of the qRT–PCR data after Wilcoxon tests with multiple comparisons correction. Please see the data availability statement for details on source data for panels A, B and D.

