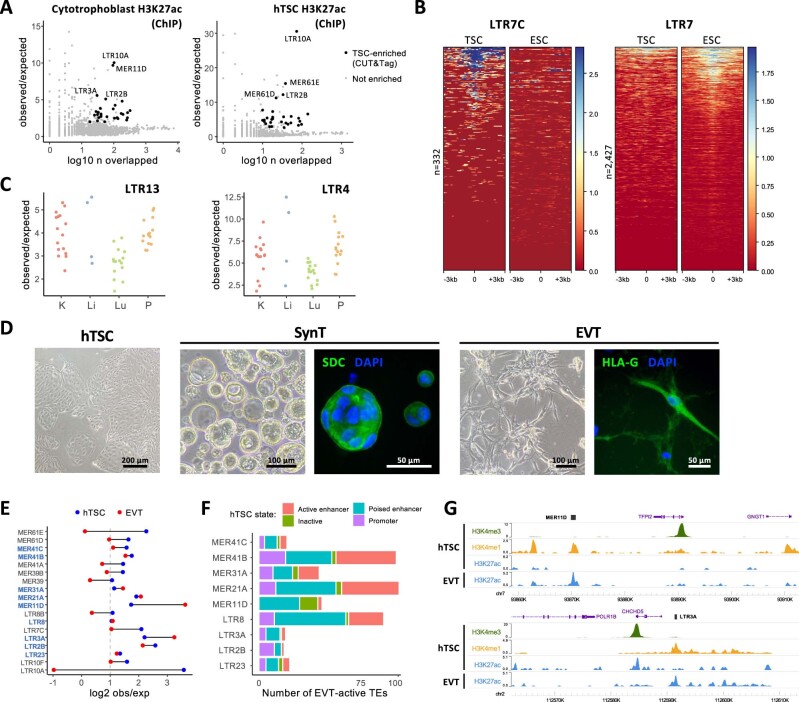
Extended Data Fig. 1. ERV regulatory signatures in undifferentiated and differentiated cells.
A, Enrichment for H3K27ac peaks for each repeat family in ChIP-seq data from primary cytotrophoblast (n = 2) or hTSCs (n = 1). Families with significant enrichment in CUT&Tag data from hTSCs (Fig. 1b) are highlighted. B, H3K27ac profiles of LTR7C and LTR7 families in hTSCs and hESCs. Each line represents an element in that family. C, Enrichment for Dnase hypersensitive sites in LTR13 and LTR4 families, in the kidney (K), liver (Li), lung (Lu) and placenta (P). Each datapoint represents a different ENCODE dataset. D, Representative phase contrast and immunofluorescence images for hTSCs and hTSC-derived SynT and EVT. Expression of the SynT marker SDC or EVT marker HLAG is shown (green), with DAPI counterstain (blue). E, Enrichment for H3K27ac peaks in hTSC or EVT for all hTSC-enriched ERV families. Families that are also significantly enriched in EVT are highlighted in blue. F, Number of H3K27ac-marked ERVs in EVT, divided by their chromatin state in hTSCs: active enhancer (H3K4me1 + H3K27ac), poised enhancer (H3K4me1 alone), promoter (H3K4me3) or inactive (none of the three marks). G, Genome browser snapshots showing examples of ERVs that are in a poised state in hTSCs and become active in EVT. Please see the data availability statement for details on source data for panels A, C, E and F.

