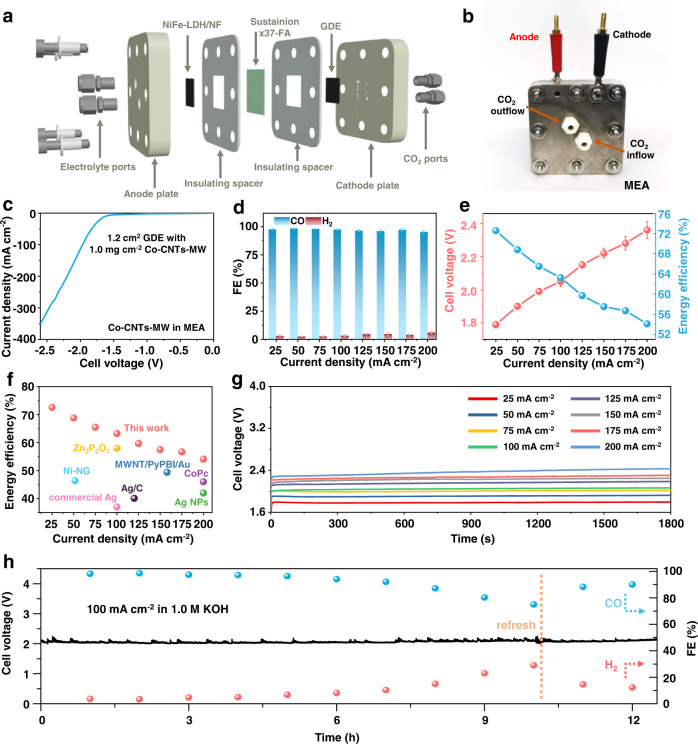
Fig. 3. Evaluation of CO2RR performances in MEA full-cell configuration.
a 3D structural diagram and b photograph of MEA configuration. c LSV curve of Co-CNTs-MW in MEA at a scan rate of 10 mV s−1. d CO and H2 Faradaic efficiencies on Co-CNTs-MW catalyst in the range of current densities from 25 to 200 mA cm−2 in MEA. e Cell voltage and full-cell energy efficiency on Co-CNTs-MW catalyst in MEA (all cell voltages were not iR-corrected). The error bars represent the standard deviation of three measurements. f Full-cell energy efficiency of Co-CNTs-MW catalyst compared with state-of-the-art CO2-to-CO conversion electrocatalysts. CoPc44, Ni-NG18, MWNT/PyPBI/Au45, Ag nanoparticles46, Ag/C47, commercial Ag48, and Zn2P2O749 were selected as references. More details were summarized in Table S3. g Cell voltage at different current densities in 1800 s electrolysis. h Long-term electrolysis under a current density of 100 mA cm−2 in MEA. The electrolyte tested in c–h is 1.0 M KOH. The loading of Co-CNTs-MW is 1.0 mg cm−2.

