Figure 2.
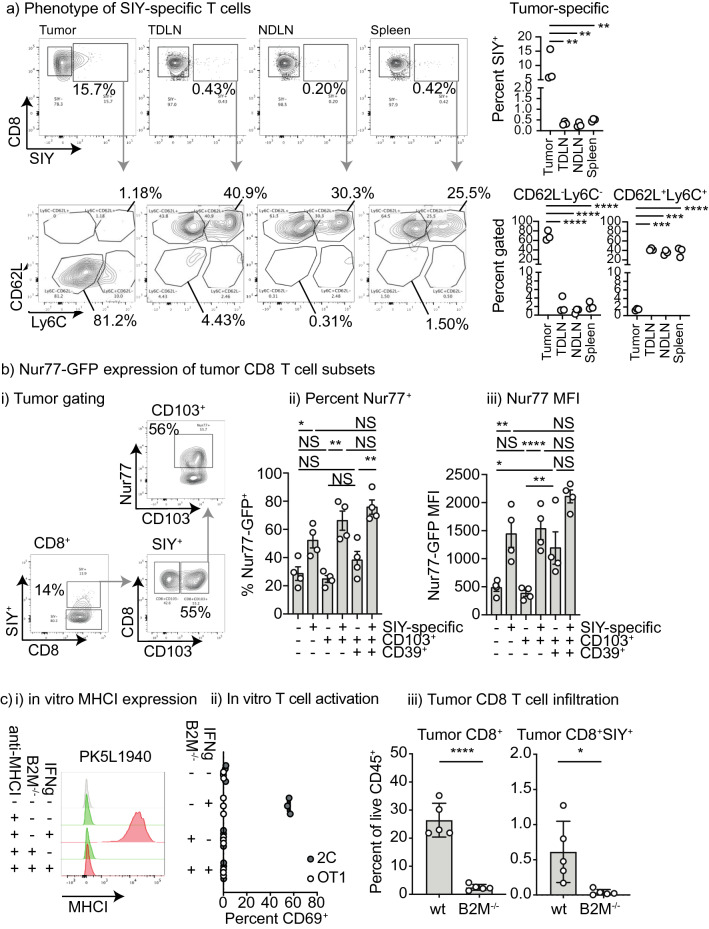
Direct interaction of tumor antigen specific T cells with antigen in tumors. (a) Analysis of CD8 T cells in tumor and peripheral lymphoid organs. PK5L1940 tumors were implanted sc. into C57BL/6 mice and tumors, tumor-draining lymph node (TDLN), non-draining lymph node (NDLN), and spleen were analyzed for SIY-specific CD8 T cells at d14. Subplots show CD62L and Ly6C expression on SIY-specific CD8 T cell populations in the lymphoid organs versus the tumor. (b) PK5L1940 tumors were implanted sc. into Nur77-GFP mice and tumor infiltrating T cells were analyzed by flow cytometry. (i) representative flow plots. The SIY-specific T cell population of infiltrating CD8 T cells was identified by pentamer staining, and CD103 + and CD103 + CD39 + subpopulations were identified and Nur77-GFP expression was determined in each cell type. Graphs show (ii) Percent Nur77-GFP + and (iii) MFI of Nur77-GFP in each group. (c) PK5L1940 cancer cells were deleted of B2M expression using CRISPR/Cas9. (i) MHCI expression in cancer cells was detected by flow cytometry compared to isotype control antibody (gray), with cells untreated (green) or pre-treated with IFNg (red). (ii) PK5L1940 or PK5L1940-B2M−/− were co-cultured with SIY-specific 2C cells or Ova-specific OT1 cells and assessed for expression of the activation marker CD69. (iii) PK5L1940 or PK5L1940-B2M−/− were implanted sc. into C57BL/6 mice and harvested at d14 and analyzed for infiltrating CD8 T cells and SIY-specific CD8 T cells by flow cytometry. Key: NS = not significant; * = p < 0.05; ** = p < 0.01; *** = p < 0.001; **** = p < 0.0001. Results are representative of two or more experiments.

