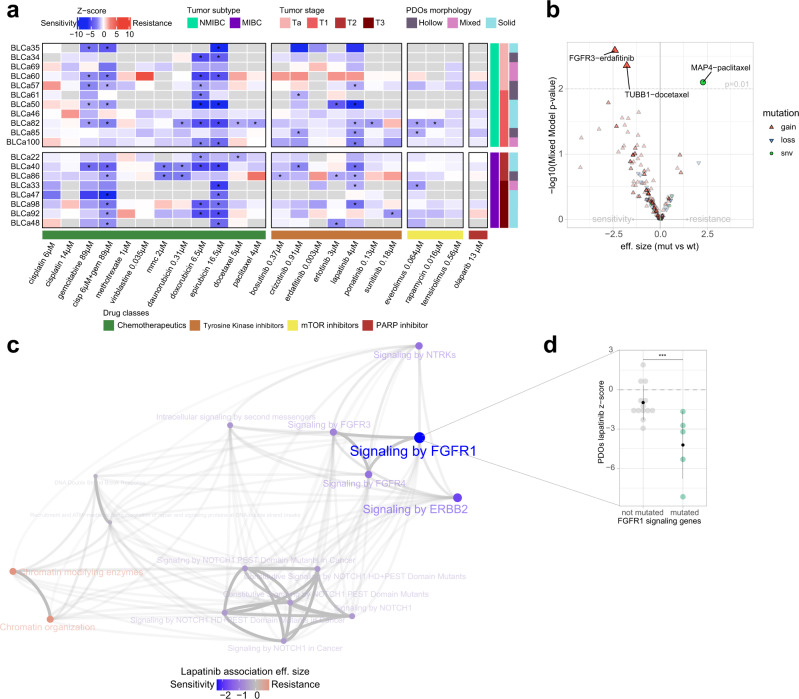
Fig. 5. Patient-derived organoid (PDO) drug response and association with gene alterations.
a Results of PDO drug screen assay (n = 19 biological samples). Heatmap reports the average of z-scores normalized to the vehicle values from cell viability assays after 48 h exposure of PDOs to drugs for one experiment for each biological sample (raw data are provided in Supplementary Data 6). Tumor subtype and stage, and PDO morphology are indicated in different colors on the right of the heatmap; not available data are in gray. Statistically significance between treatments and vehicle was calculated by one-way ANOVA test with Dunnet’s multiple comparison, *z-score ≤ −1.5 and adjusted p-value ≤ 0.05. b Genomic association analysis between genomic somatic events and treatment sensitivity/resistance. Reported p-value is obtained through Linear Mixed Model (LMM) fit (see “Methods”, section drugs association analyses) without adjusting for multiple comparisons. c Association analysis between frequently mutated pathways in PDOs and lapatinib sensitivity. Edges transparency encodes the proportion of shared genes between each term. Node size is proportional to the effect size of the association with lapatinib response (see “Methods”, section drugs association analyses). LLM. d Dot plot showing response to lapatinib in PDOs enriching for mutations on FGFR1 signaling genes compared to PDOs that do not show significant enrichment. Each data point corresponds to one biological sample (n = 18 for not mutated, n = 4 for mutated, mean +/− SD is reported in black) computed as the average z-score across technical replicates. P-value is obtained through LMM fit (see “Methods”, section drugs association analyses), ***False discovery rate = 0.02. cisp cisplatin, gem gemcitabine, mmc mitomycin C, mut mutation, wt wild type, snv single nucleotide variant.

