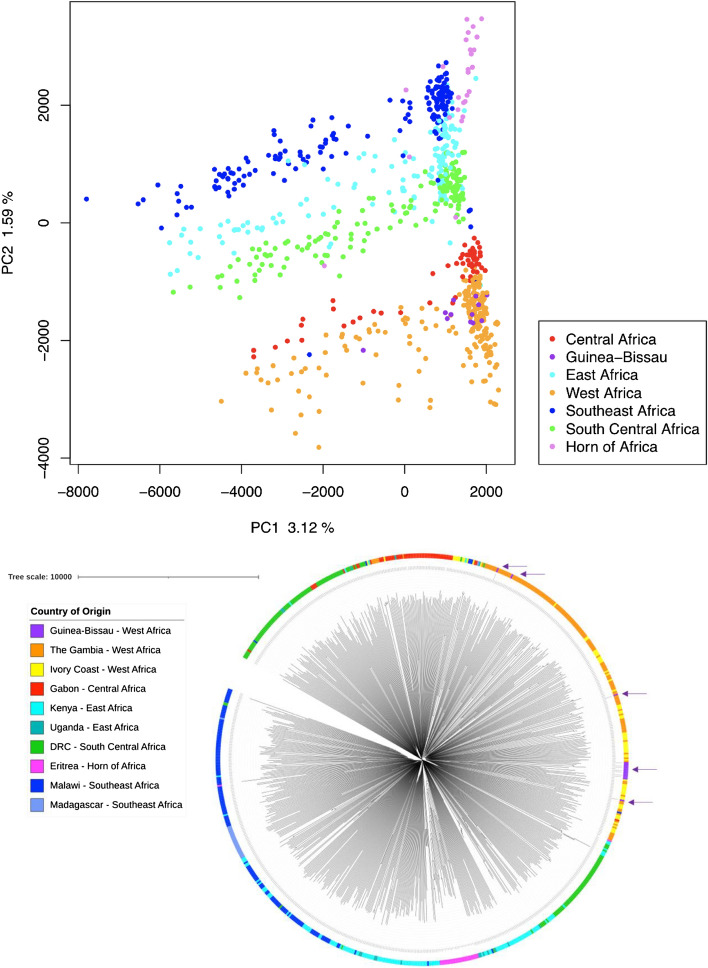
Figure 1.
Population structure analysis: (top) Principal component analysis demonstrating that the isolates from the Bijagós (in purple) cluster with other isolates from West Africa (in orange and yellow). Generated using pairwise genetic distance matrices containing 1,326,629 SNPs from 795 isolates. (bottom) Neighbour-Joining tree for the samples and SNPs described above. Isolates were sampled from Central Africa (Gabon, n = 57), West Africa (Ivory Coast n = 70, The Gambia n = 148, Bijagós Archipelago Guinea-Bissau (n = 15), East Africa (Kenya n = 138, Uganda n = 17), Southeast Africa (Malawi n = 149, Madagascar n = 24), South Central Africa (DRC n = 150) and Horn of Africa (Eritrea n = 27). Bijagós isolates (indicated with purple arrows) are found interspersed with samples from West Africa (orange and yellow).

