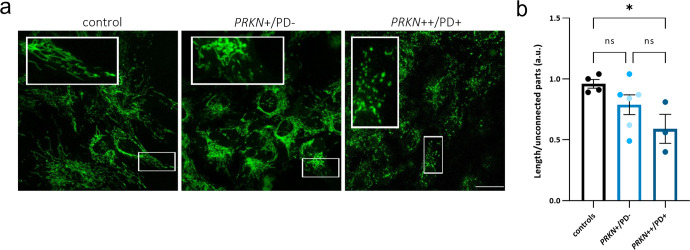
Fig. 5. Mitochondrial network morphology is unaltered in hiPSC-derived neurons of heterozygous PRKN variant carriers.
a Confocal live imaging of hiPSC-derived neurons at day 50 of differentiation, stained with MTG. Scale bar: 25 µm. b Mitochondrial fragmentation measurements in hiPSC-derived neurons of a PD patient line with homozygous variants (PRKN++/PD+), the carriers group (PRKN+/PD−) comprising two heterozygous carriers (PRKN+/PD− 1 and PRKN+/PD− 2, respectively color coded), and the control group (representing the mean values of three control lines per experiment). n = 4 independent experiments. Cell imaging and calculations were performed in at least 50 cells per sample for each experiment. Mitochondrial fragmentation was calculated with the filament function in Imaris Software: for each field, the total length of the modeled mitochondrial network was calculated and divided by the number of unconnected parts. Error bars represent the mean ± SEM. p values were determined using one-way ANOVA followed by Tukey’s post hoc test to correct for multiple comparisons. *p ≤ 0.05. a.u. arbitrary units, ns not significant.

