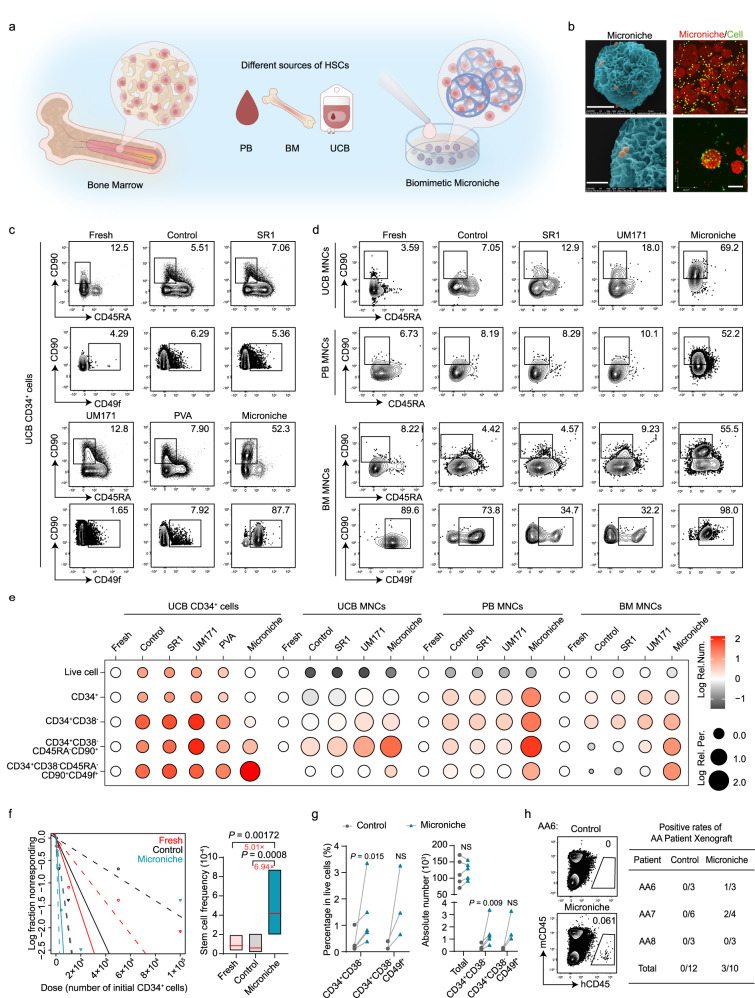
Fig. 1. The expansion of human HSCs in a Microniche-based culture system.
a Schematic of HSC expansion using the biomimetic Microniche system in petri dishes. b Scanning electron microscope images of UCB CD34+ cells cultured with Microniche (left). Scale bar, upper panel: 50 μm; lower panel: 20 μm. Representative images of co-immunofluorescent staining of live cells (Calcein AM, green) and Microniche (PI, red) in UCB CD34+ cells (right). Scale bar, 100 μm. The images represent a mean of three independent experiments each done in six replicates. Representative FACS profiles of CD34+CD38−CD45RA−CD90+ and CD34+CD38−CD45RA−CD90+CD49f+ populations in UCB CD34+ cells (c), UCB, PB or BM MNCs (d) before (fresh) and after culture in control medium (StemSpan SFEMII + 1% P/S + 10 ng/ml hSCF + 100 ng/ml hTPO) or control medium supplemented with SR1 (1 μM), UM171 (40 nM), PVA (0.1%) or Microniche. For UCB CD34+ cells, fresh n = 3 technical replicates; Microniche n = 3 biological replicates; other groups, n = 4 biological replicates. For BM and PB MNCs, n = 3 biological replicates; for UCB MNCs, fresh n = 4 technical replicates and other groups n = 3 biological replicates. e Dot plot showing the Log absolute cell counts (color) and Log percentages (size) of phenotype-defined cell subsets relative to the fresh cell group in the in vitro culture assays of (c) and (d). Data were normalized with data of fresh group from each source. In UCB MNCs, the data of CD34+CD38−CD45RA−CD90+CD49f+ was normalized with data of control group. f Graph of limiting dilution assays and stem cell frequency in primary engraftment. Apparent flow cytometric clustering of human CD45 was defined as successful engraftment. Fresh n = 43, Control n = 30, Microniche n = 36 biologically independent animals. Chi-square test. Solid lines indicate best-fit linear model and dashed lines confidence intervals. Box plots show the median (middle line) with the 25th and 75th percentiles (box). g Percentage and absolute number of total live cells, CD34+CD38− (n = 5 biological replicates) and CD34+CD38−CD49f+ (n = 3 biological replicates) cells derived from AA patients after culture. Each pair of data points represents a single AA case. Paired two-tailed Student’s t test. NS not significant. h Representative FACS profiles of the engrafting human CD45+ cells in BM of NOG mice 16 weeks post-transplantation (left). Apparent flow cytometric clustering of human CD45 was defined as successful engraftment. Positive xenograft rates of control- and Microniche-expanded AA patient-derived MNCs (right).

