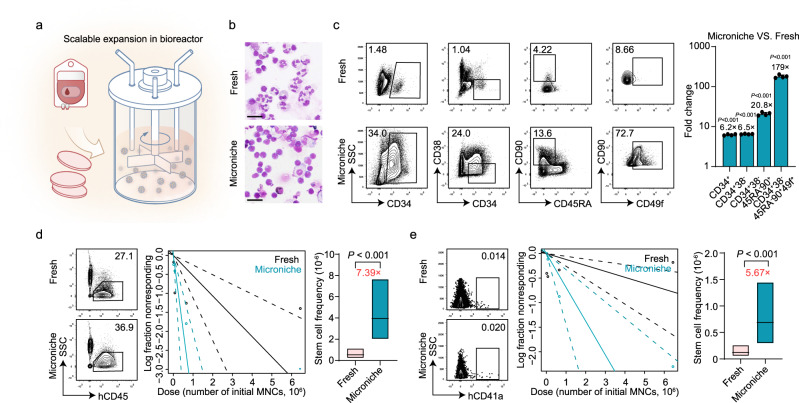
Fig. 3. Large-scale dynamic bulk-culture with Microniche.
a Schematic of HSC expansion using the biomimetic Microniche system in a large-scale, stirred bioreactor. b Photomicrographs of Wright-Giemsa stained fresh UCB MNCs and cells after culture in a dynamic stirred Microniche-based bioreactor. Scale bar, 25 μm. n = 3 biological replicates, with similar results. c Representative FACS profiles and fold change of absolute counts of indicated UCB MNC subpopulations before (fresh) and after 3 days of expansion in a dynamic stirred Microniche-based bioreactor. Fresh, n = 4 technical replicates; Microniche, n = 4 biological replicates. All data represent means ± s.d.; unpaired two-tailed Student’s t test. d Representative FACS profiles and stem cell frequency based on the mCD45−hCD45+ subpopulation 16 weeks post-transplantation in xenograft NCG mice. Fresh n = 38, Microniche n = 40 biologically independent animals. Chi-square test. Solid lines indicate best-fit linear model and dashed lines confidence intervals. Box plots show the median (middle line) with the 25th and 75th percentiles (box). e Representative FACS profiles and Mk-HSC frequency based on the mCD45−hCD45−mCD41−mCD42d−mCD61−hCD41a+ subpopulation 16 weeks post-transplantation. Fresh n = 38, Microniche n = 40 biologically independent animals. Chi-square test. Solid lines indicate best-fit linear model and dashed lines confidence intervals. Box plots show the median (middle line) with the 25th and 75th percentiles (box).

