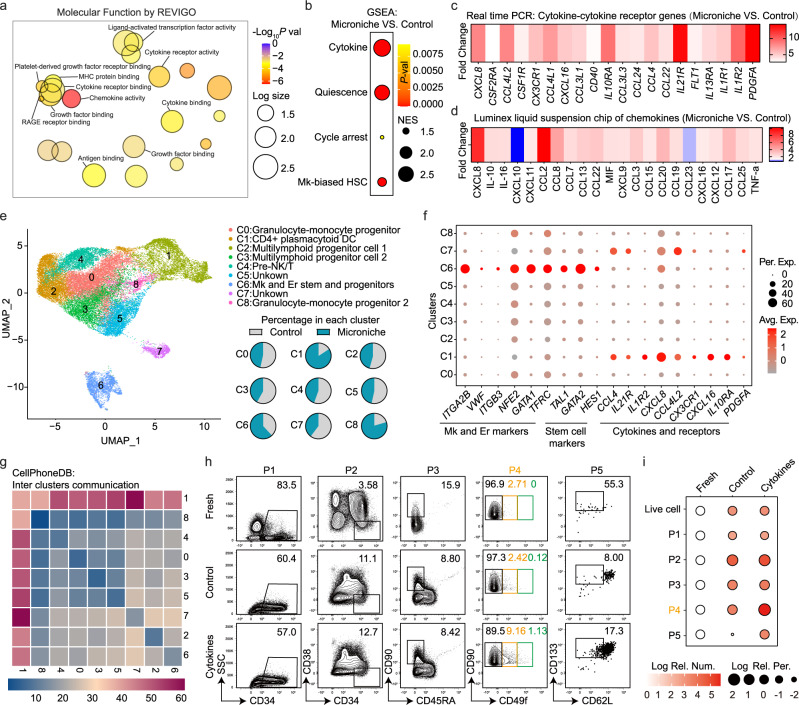
Fig. 5. Cytokine profiles between control medium and Microniche.
a REVIGO interactive graph of major Gene Ontology molecular function (GO MF) terms in RNA-seq of sorted CD34+ cells after culture. Bubble color indicates −Log10 p value; bubble size indicates GO term frequency. b GSEA of the indicated gene sets enriched in Microniche vs. control. Bubble size indicates normalized enrichment score (NES); bubble color indicates p value. c Heatmap of average relative expression for cytokine-cytokine receptor genes enriched in Microniche-cultured CD34+ cells. Color indicates fold change in expression levels quantified by qPCR. d Heatmap showing the average relative secretion of chemokines enriched in Microniche culture supernatant. Color indicates fold change in chemokine levels determined by Luminex liquid suspension chip. e Identification of nine cell clusters visualized by UMAP in 10X Genomics single-cell RNA-seq profile of CD34+ cells sorted after culture. Each dot represents one cell, and colors represent distinct cell clusters (C0–C8). Pie chart showing the percentages of each cell cluster in control and Microniche cultures. f Dot plot showing the expression of feature genes related to Mk and Er lineage, HSC stemness, chemokines, cytokines, and receptors in each cell cluster. Bubble color indicates average relative expression; bubble size indicates percentage of relative expression. g CellPhoneDB analysis of crosstalk between cell clusters. h Representative FACS profiles of phenotype-defined cell subsets in UCB CD34+ cells before (fresh) and after cultured with or without cytokines (CXCL8, CCL24, IL-10, IL-1β, IL-1α) for 7 days. P1: CD34+, P2: CD34+CD38−, P3: CD34+CD38−CD45RA−CD90+, P4: CD34+CD38−CD45RA−CD90+CD49flow, P5: CD34+CD38−CD45RA−CD90+CD49flowCD62L−CD133+. i Dot plot showing the absolute numbers and percentages of phenotype-defined cell subpopulations. For each subpopulation, their changes after culture are summarized as Log number and Log percentage relative to fresh, with color (red) depth indicating the size of absolute numbers and bubble size indicating the size of percentages in living cells. Fresh, n = 3 technical replicates; control and cytokines, n = 4 biological replicates. Data were normalized with data of fresh group.

