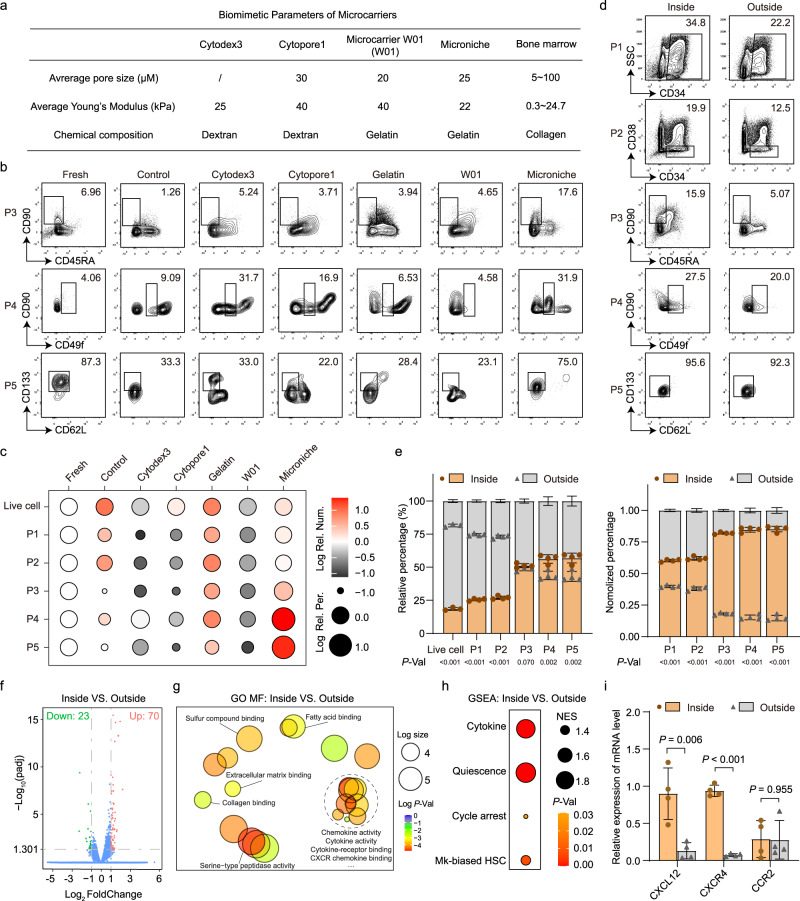
Fig. 6. The effect of physical structure to expansion of primitive and Mk-biased HSCs.
a Comparison of biomimetic parameters between different biomaterials and bone marrow. b Representative FACS profiles of CD34+CD38−CD45RA−CD90+ (P3), CD34+CD38−CD45RA−CD90+CD49flow (P4), and CD34+CD38−CD45RA−CD90+CD49flowCD62L−CD133+ (P5) populations in UCB CD34+ cells before (fresh) and after culture in control medium or control medium supplemented with Cytodex3, Cytopore1, Gelatin, Microcarrier W01, or Microniche. Fresh, n = 3 technical replicates; other groups, n = 3 biological replicates. c Dot plot showing the Log absolute cell counts (color) and Log percentages (size) of phenotype-defined cell subsets relative to the fresh cell group in the in vitro culture assays of (b). Data were normalized with data of fresh group. d Representative FACS profiles of CD34+ (P1), CD34+CD38− (P2), P3, P4, and P5 populations inside or outside Microniche in cultured UCB CD34+ cells. e Relative percentage (left) and normalized percentage (right) of live, P1, P2, P3, P4, and P5 populations inside or outside the Microniche after 7 days in culture (n = 4 biological replicates). All data represent means ± s.d. f Volcano plot of differentially expressed genes (DEGs) between cultured cells inside and outside the Microniche. g REVIGO interactive graph of major Gene Ontology molecular function (GO MF) terms in RNA-seq analysis of cultured cells inside and outside the Microniche. Bubble color indicates Log p value; bubble size indicates GO term frequency. h GSEA of the indicated gene sets enriched in cultured cells inside vs. outside Microniche. Bubble size indicates normalized enrichment score (NES); bubble color indicates p value. i Relative expression for the genes implicated in HSC maintenance and retention in BM between cultured cells inside and outside the Microniche (n = 4 biological replicates). All data represent means ± s.d. Unpaired two-tailed Student’s t test.

