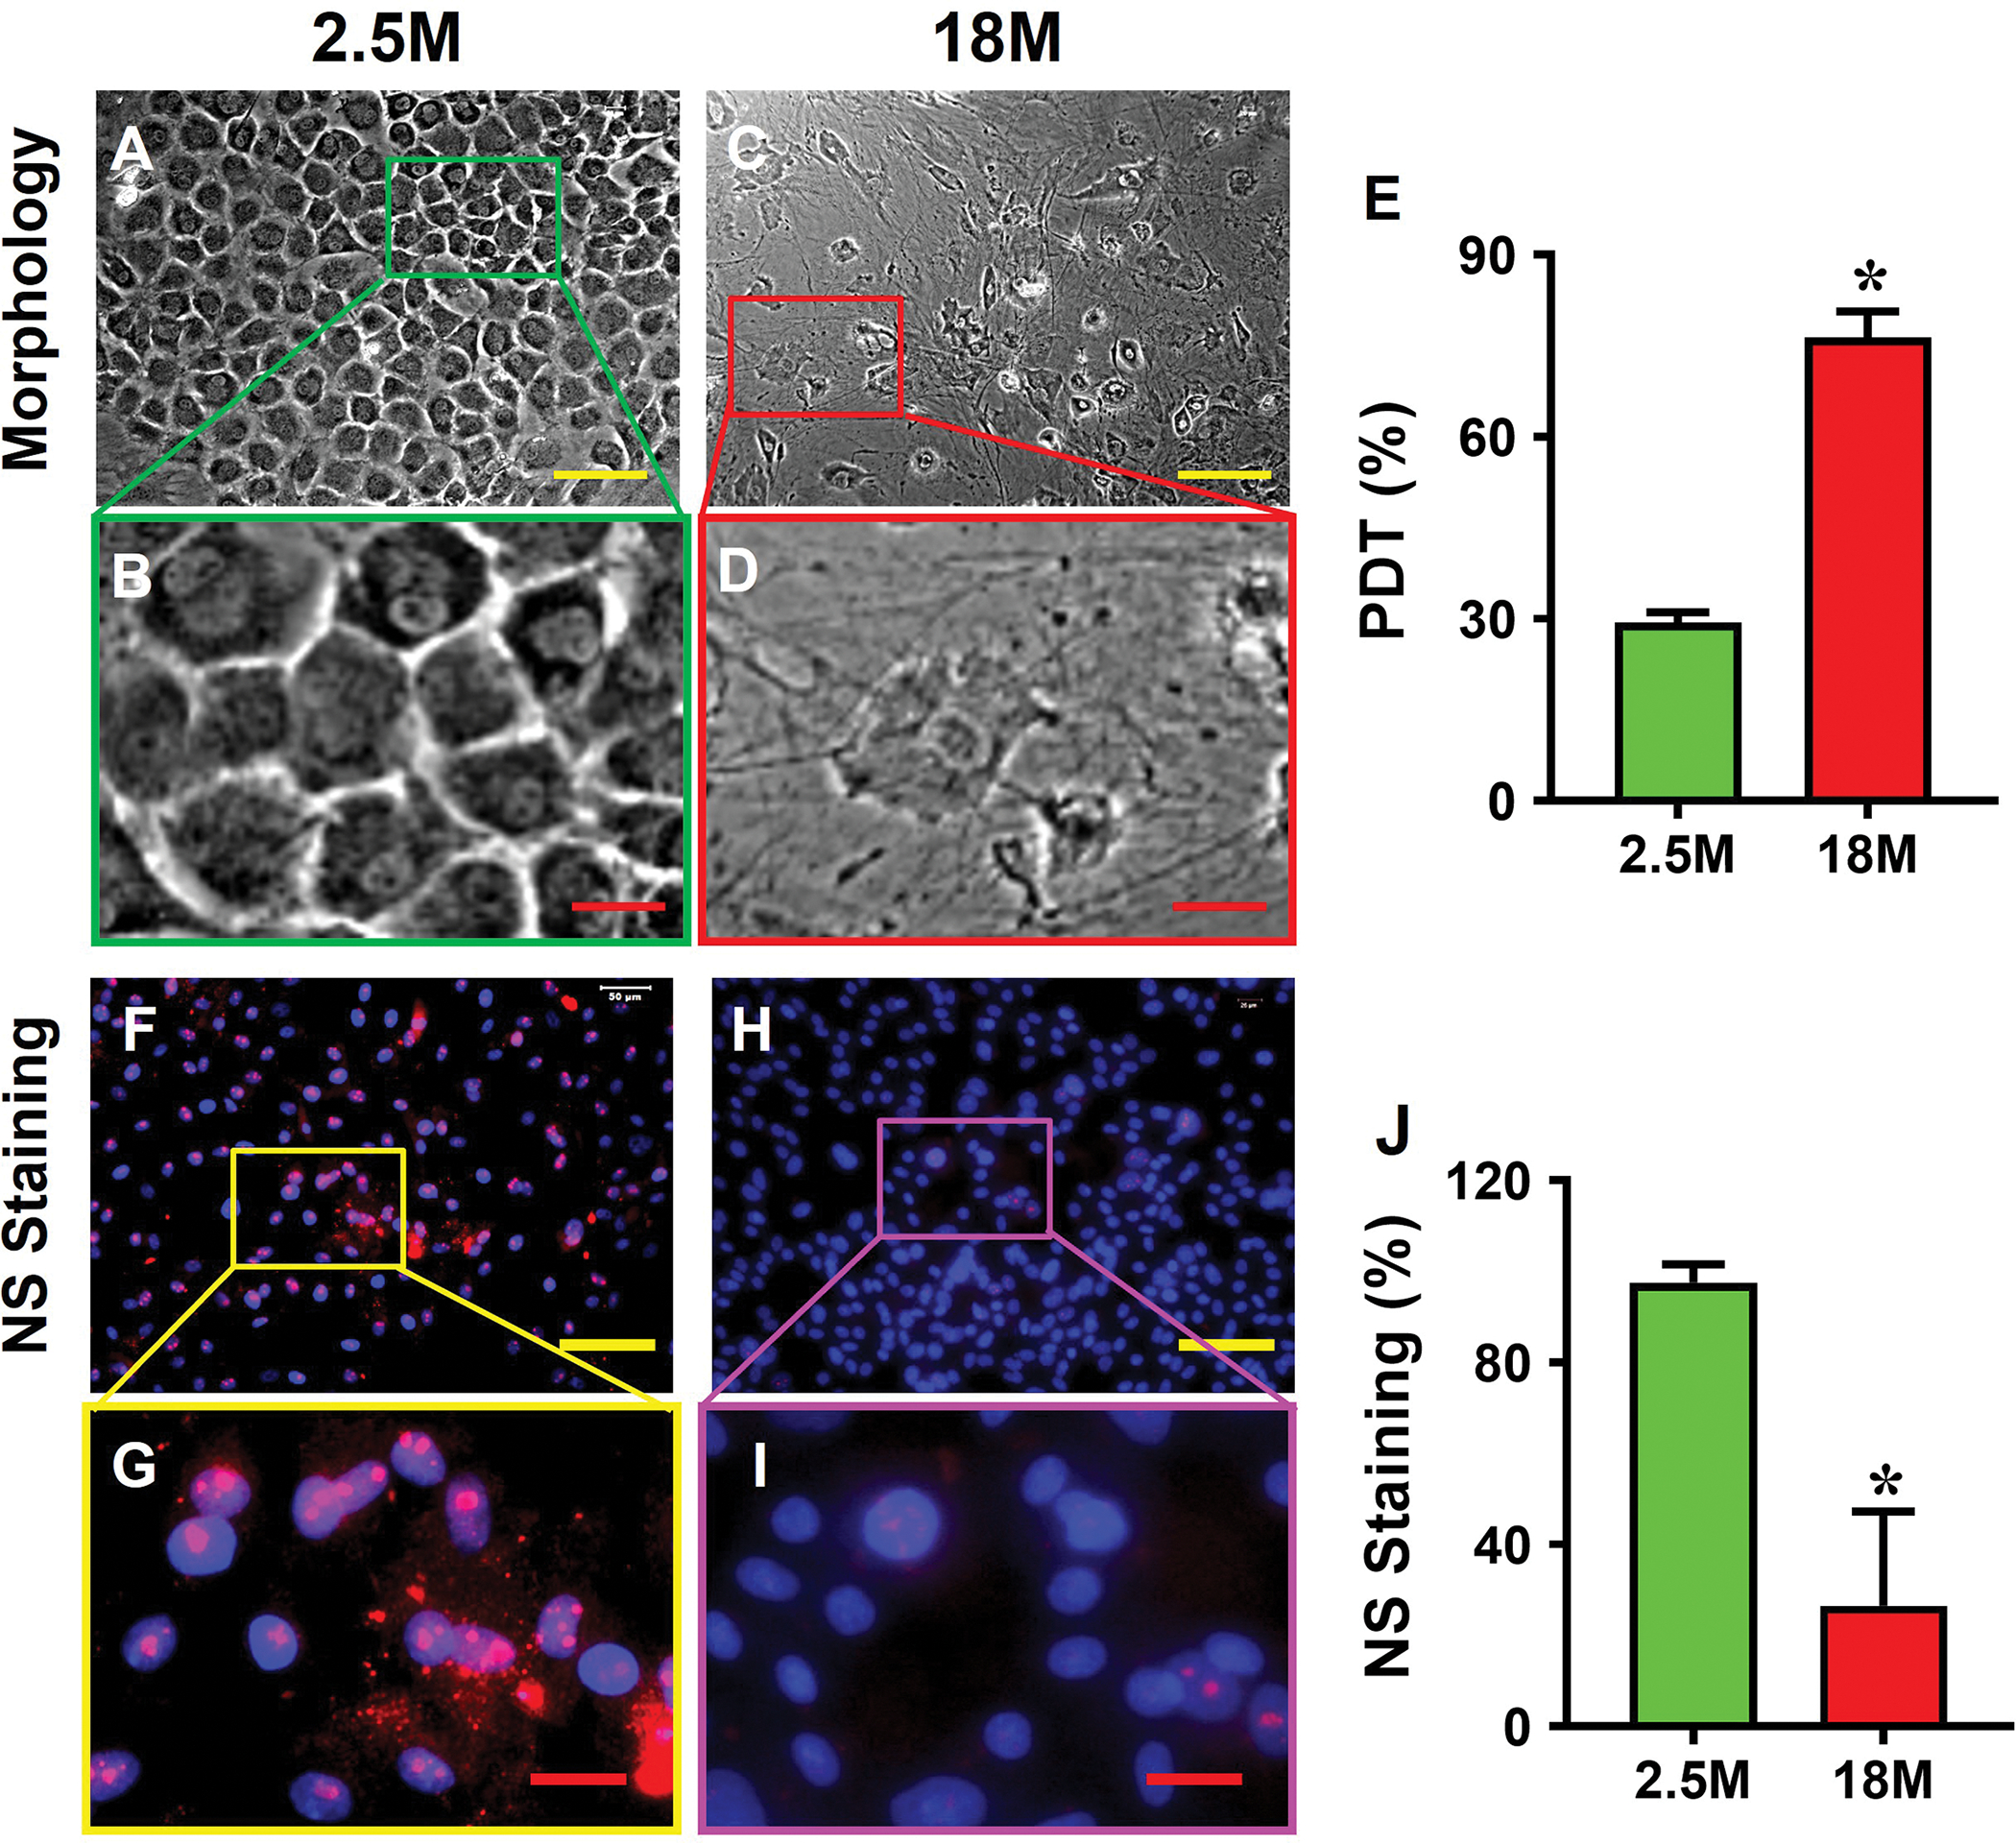
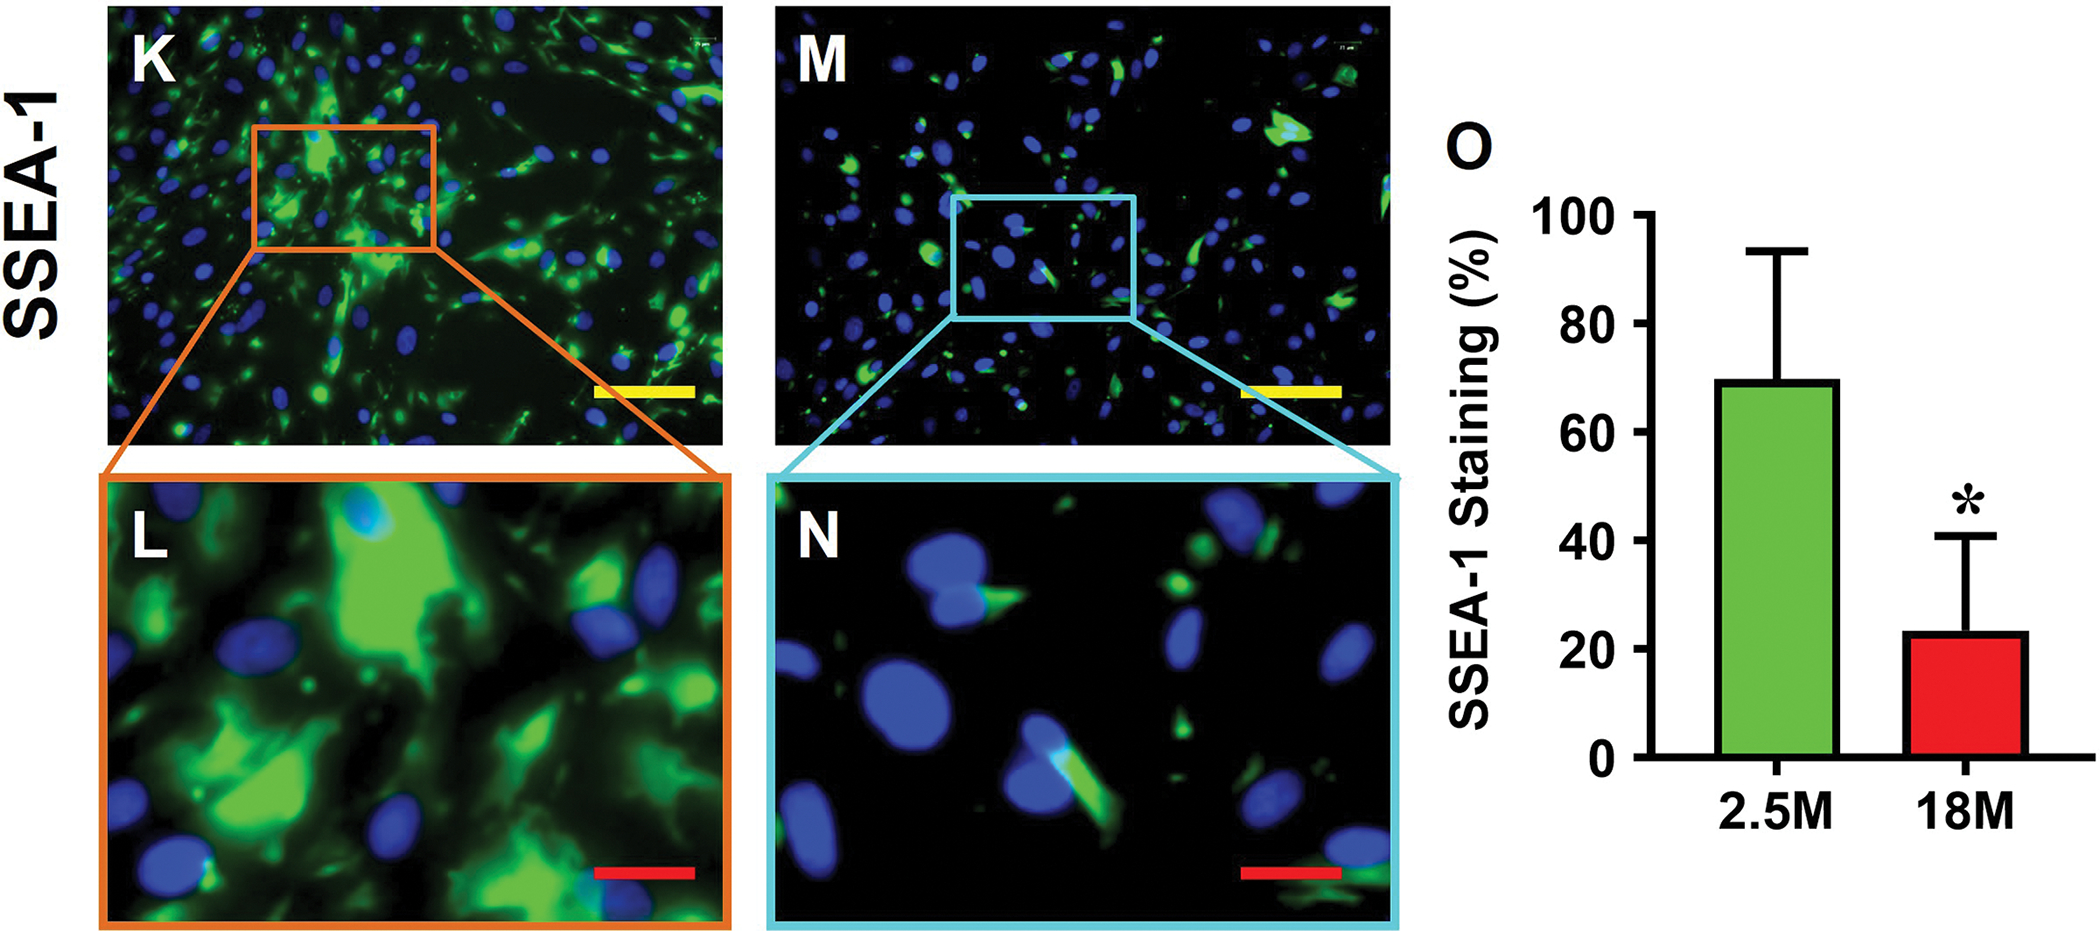
Fig. 4. Cell morphology, proliferation, and stem cell marker expression in young vs aging tendon.


Young tendon cells are cobble-stone-like in shape (A, B), but the cells isolated from aging tendon are pancake-like in shape (C, D). PDT results show that the cells isolated from young tendon grow much faster than the cells isolated from aging tendon (E). Immunostaining for NS shows that more than 90% of the cells isolated from young mouse tendon tissues are positively stained with NS (F, G), but less than 27% of the cells isolated from aging tendon tissues are positively stained with NS (red in H, I). Similarly, more than 69% of the cells isolated from young tendon tissues are positively stained with SSEA-1 (green in K, L), but less than 24% of the aging tendon cells express SSEA-1 (green in M, N). These results are further confirmed by semi-quantification (J, O). Yellow bars: 100 μm; Red bars: 25 μm, *p < 0.01 (aging compared to young).
