Figure 4.

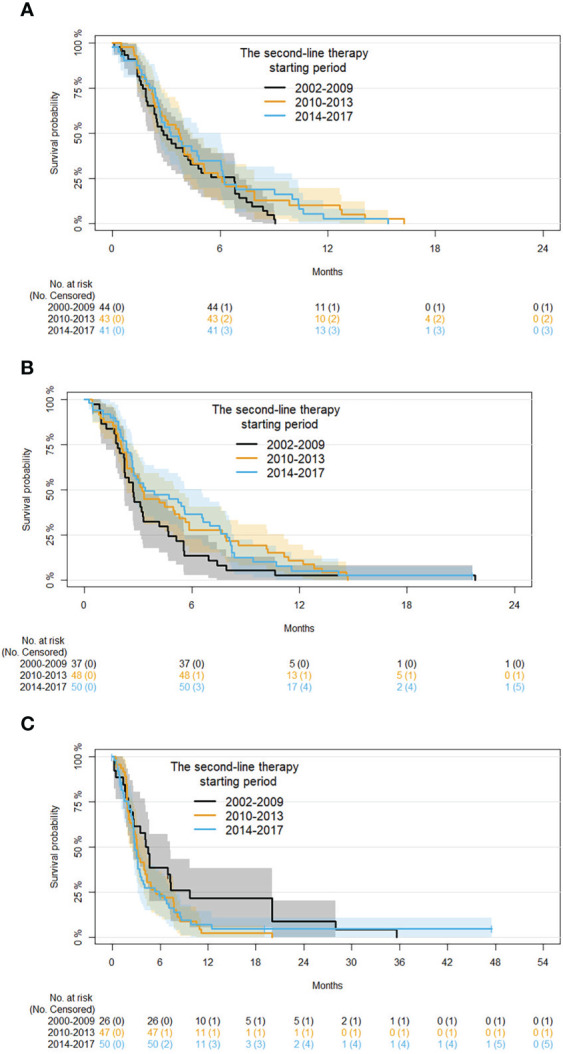
Kaplan-Meier curves for PFS by period of second-line therapy and age (subgroup analysis on patients with age ≤60, 61 to 70, and ≥71 years are shown in panels (A-C), respectively).

Kaplan-Meier curves for PFS by period of second-line therapy and age (subgroup analysis on patients with age ≤60, 61 to 70, and ≥71 years are shown in panels (A-C), respectively).