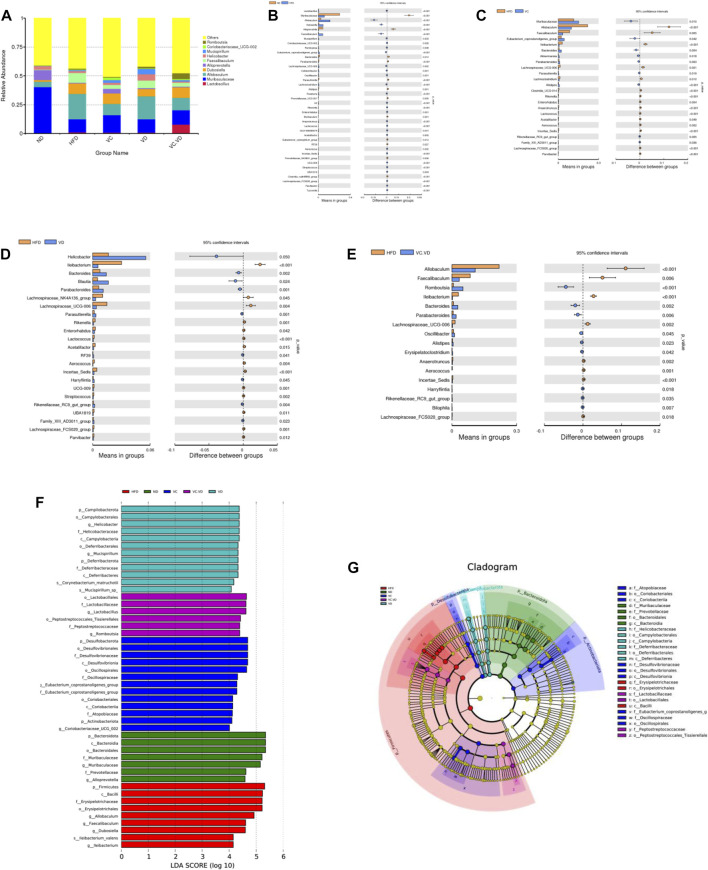
FIGURE 3.
VC and VD3 improved the gut microbiota in obese mice. (A) Relative abundances at the genus level. (B–E) Discrepancy in the gut microbiota composition between groups at the genus level. Species with significant differences between the ND and HFD groups (B), HFD and VC groups (C), HFD and VD groups (D), and HFD and VC + VD groups (E) were analyzed. A significant discrepancy was defined as p < 0.05 according to the t-test. (F) LEfSe analysis of the dominant biomarker taxa among the five groups. The threshold of the logarithmic score of LDA was 4.0. (G) Taxonomic cladogram obtained from LEfSe analysis by comparing the 5 groups. (n = 12 mice/group).

