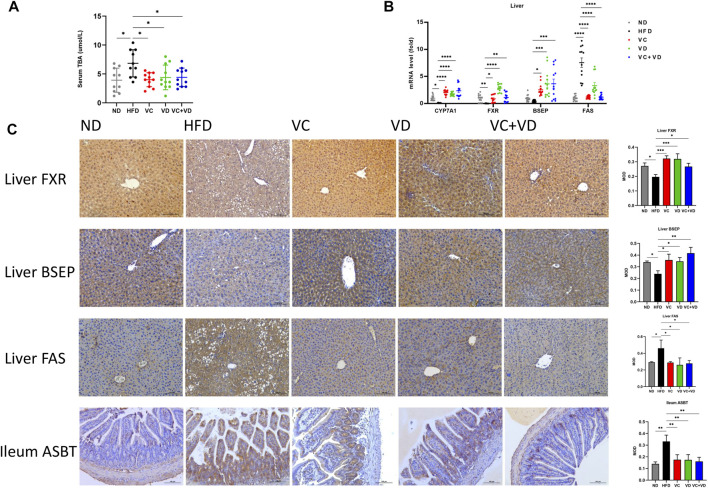
FIGURE 8.
VC and VD3 attenuated bile acid metabolism dysfunction in the gut-liver axis in obese mice. (A) Serum levels of total bile acid. (B) Expression of mRNAs involved in the regulation of the synthesis and transport of bile acids and fatty acid synthase (FAS) in the liver. (C) Immunohistochemistry analysis of FXR, BSEP, and FAS in the liver and ASBT in the ileum of mice. The brown dot indicates the target protein. Representative images were captured. Scale bar, 100 µm. Data are shown as the means ± SDs (n = 12 mice/group), *p < 0.05, **p < 0.01, ***p < 0.001, ****p < 0.0001.

