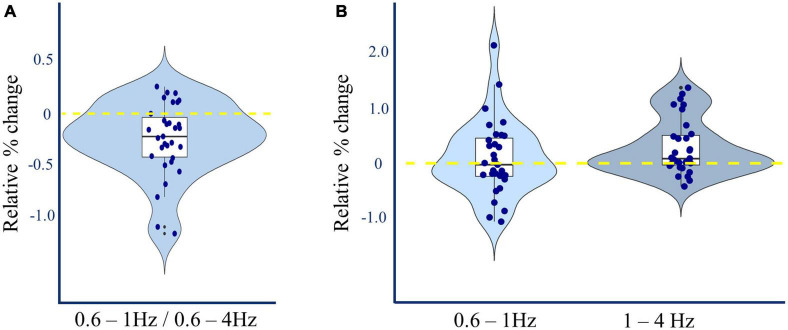
FIGURE 4.
L-DOPA and non-REM spectral power. (A) Relative change in 0.6–1Hz/0.6–4Hz N3 Slow Wave Activity. Dopamine induced a 0.248% average reduction in the proportion of 0.6–1.0 Hz compared to 0.6–4.0 Hz spectral power in slow wave sleep averaged across all channels [paired t(30) = –3.928, Cohen’s δ = –0.22, p < 0.001, pcorrected = 0.001, ndependent tests = 3]. This reduction was manifest in 24 out of 31 participants. (B) Relative change in N3 Slow Wave Activity by frequency. Dopamine induced a 0.30 dB mean increase in 1–4 Hz spectral power during slow wave sleep, averaged across all channels [t(30) = 3.206, Cohen’s δ = 0.22, p = 0.003, pcorrected = 0.005, ndependent tests = 3], without corresponding increase in 0.6–1 Hz spectral power.

