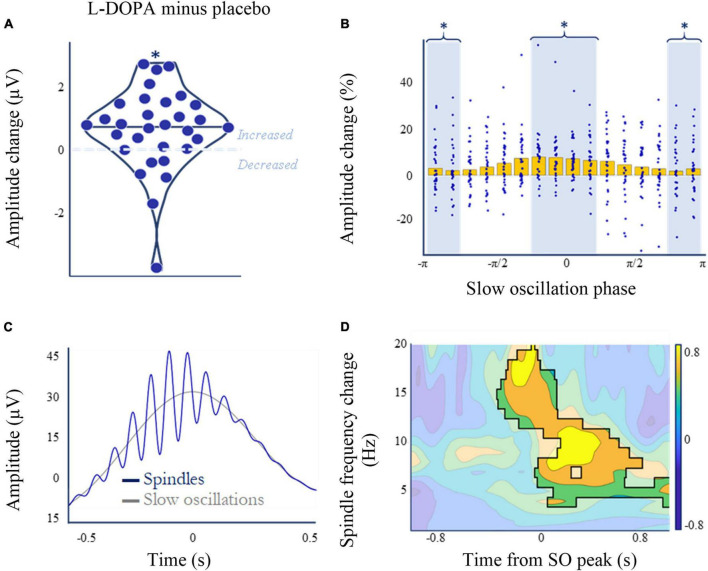
FIGURE 5.
L-DOPA, memory, and spindle amplitude during slow wave sleep (N3). (A) Nocturnal L-DOPA increased mean spindle amplitude during slow wave sleep (Wilcoxon’s z = 401, p = 0.002, pcorrected = 0.008, ndependent tests = 4, BF10 = 3.6; rank biserial correlation = 0.62). (B) The dopamine-induced spindle amplitude increase (A) was slow-wave phase-dependent. Mean spindle amplitude change (normalised to baseline amplitude ([placebo + L-DOPA]/2) is higer on L-DOPA around the zero phase of slow-waves [t(30) = 2.12, p = 0.043, BF10 = 1.3]. (C) Spindle amplitude peaked in the –π/4 to –π/8 phase bin for both placebo and L-DOPA. Peak locked grand average mean slow-wave events (grey) superimposed with the peak-locked average of all spindle events (blue) that occurred during slow oscillations—averaged across both L-DOPA and placebo nights. (D) Paired permutation cluster analysis in time-frequency space comparing L-DOPA and placebo conditions for all slow-wave - spindle co-occurrence events, centred on the slow-wave peak. All shown differences denote increased activity on L-DOPA (cluster threshold of α = 0.01, time frequency space outside significant clusters is greyed). Overall p = 0.002 for the largest cluster. *p < 0.05.

