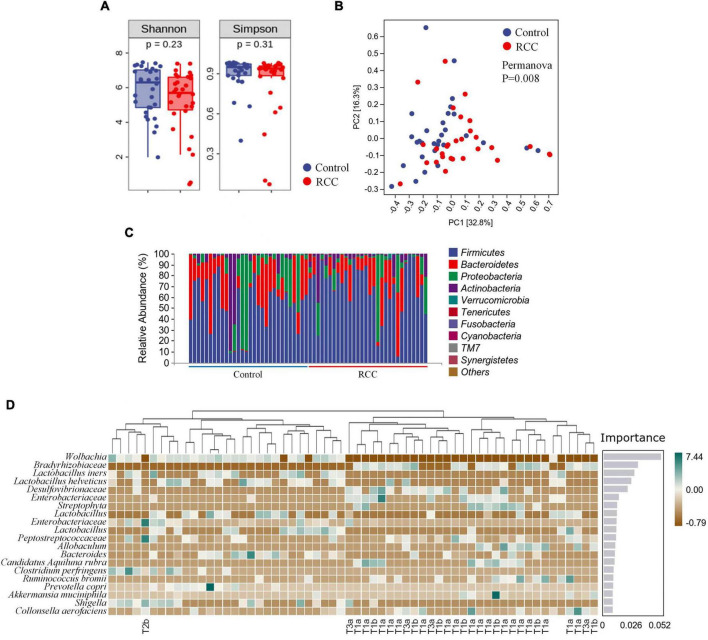
FIGURE 1.
Characterization of gut microbiota were identified in the RCC and Control groups. (A) Alpha diversity of gut microbiota. The within-sample diversity of the RCC group and Control group were measured in terms of Shannon index and Simpson index. (B) Assessment of overall gut microbiota structures between the two groups using PERMANOVA analysis. PC1, principal coordinate 1; PC2, principal coordinate 2. (C) Relative abundance of gut microbiota in the two groups at phyla level. (D) Altered 20 genera significantly in the RCC group (marked with pathological grade) compared to Control group arranged based on the potential importance by Random Forest analysis. Green indicates positive correlation; brown indicates negative correlation. Non-significant P > 0.05.

