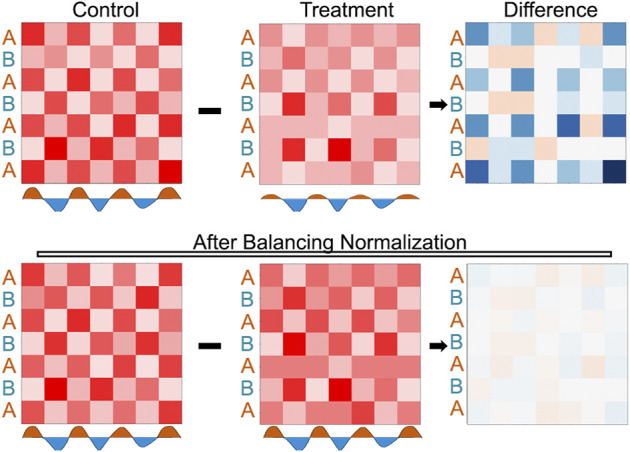
FIGURE 6.

Demonstration of how matrix balancing can obscure widespread changes. Top row: An example checkerboard matrix (control) where the signal along the A compartment becomes decreased (treatment), the differences shown by the intensity of blue signal on the right (difference). Bottom row: The same checkerboards and the differences after matrix balancing.
