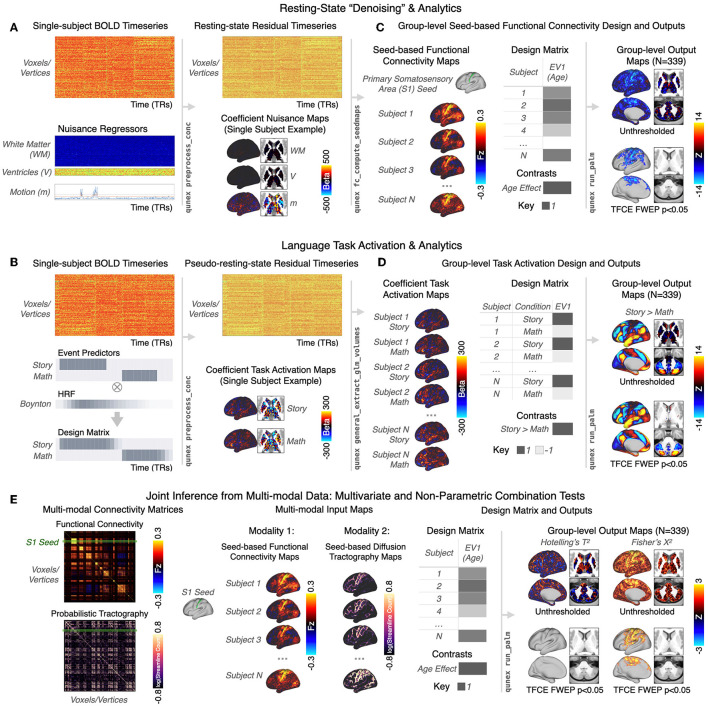
Figure 5.
General Linear Model (GLM) for single-session modeling of time-series modalities and integrated interoperability with PALM for group-level analytics. (A) The QuNex GLM framework enables denoising and/or event modeling of resting-state and task BOLD images at the individual-session level in a single step. A use case is shown for resting-state BOLD data. At the single-subject level, FL FLthe user can choose to specify FL individual nuisance regressors (such as white matter and ventricular signal and motion parameters) such that they are regressed out of the BOLD timeseries with the qunex preprocess_conc function. The regressors can be per-frame (as shown), per-trial, or even per-block. The GLM outputs a residual timeseries of “denoised” resting-state data as well as one coefficient map per nuisance regressor. The resting-state data for each subject can then be used to calculate subject-specific feature maps, such as seed-based functional connectivity maps with qunex fc_compute_seedmaps. (B) The GLM engine can also be used for complex modeling and analysis of task events, following a similar framework. Event modeling is specified in qunex preprocess_conc by providing the associated event file; the method of modeling can be either assumed (using a hemodynamic response function [HRF] of the user's choosing, e.g. Boynton) or unassumed. Here, an example from the HCP's Language task is shown. The two events, “Story” and “Math,” are convolved with the Boynton HRF to build the subject-level GLM. As with the resting-state use case shown in (A), the GLM outputs the single-subject residual timeseries (in this case “pseudo-resting state”) as well as the coefficient maps for each regressor, here the Story and Math tasks. (C) Connectivity maps from all subjects can then be entered into a group-level GLM analysis. In this example, the linear relationship between connectivity from the primary somatosensory area (S1) seed and age across subjects is tested in a simple GLM design with one group and one explanatory variable (EV) covariate, demeaned age. QuNex supports flexible group-level GLM analyses with non-parametric tests via Permutation Analysis of Linear Models (PALM, Winkler et al., 2014), through the qunex run_palm function. The specification of the GLM and individual contrasts is completely configurable and allows for flexible and specific hypothesis testing. Group-level outputs include full uncorrected statistical maps for each specified contrast as well as p-value maps that can be used for thresholding. Significance for group-level statistical maps can be assessed with the native PALM support for TFCE (Winkler et al., 2014, shown) or cluster statistics with familywise error protection (FWEP). (D) The subject-level task coefficient maps can then be input into the qunex run_palm command along with the group-level design matrix and contrasts. The group-level output maps show the differences in activation between the Story and Math conditions. (E) QuNex also supports multi-variate and joint inference tests for testing hypotheses using data from multiple modalities, such as BOLD signal and dMRI. Example connectivity matrices are shown for these two modalities, with the S1 seed highlighted. Similar to the use cases shown above, maps from all subjects can be entered into a group-level analysis with a group-level design matrix and contrasts using the qunex run_palm command. In this example, the relationship between age and S1-seeded functional connectivity and structural connectivity is assessed using a Hotelling's T2 test and Fisher's X2. The resulting output maps show the unthresholded and thresholded (p < 0.05 FWEP, 10,000 permutations) relationship between age and both neural modalities.

