Figure 1.
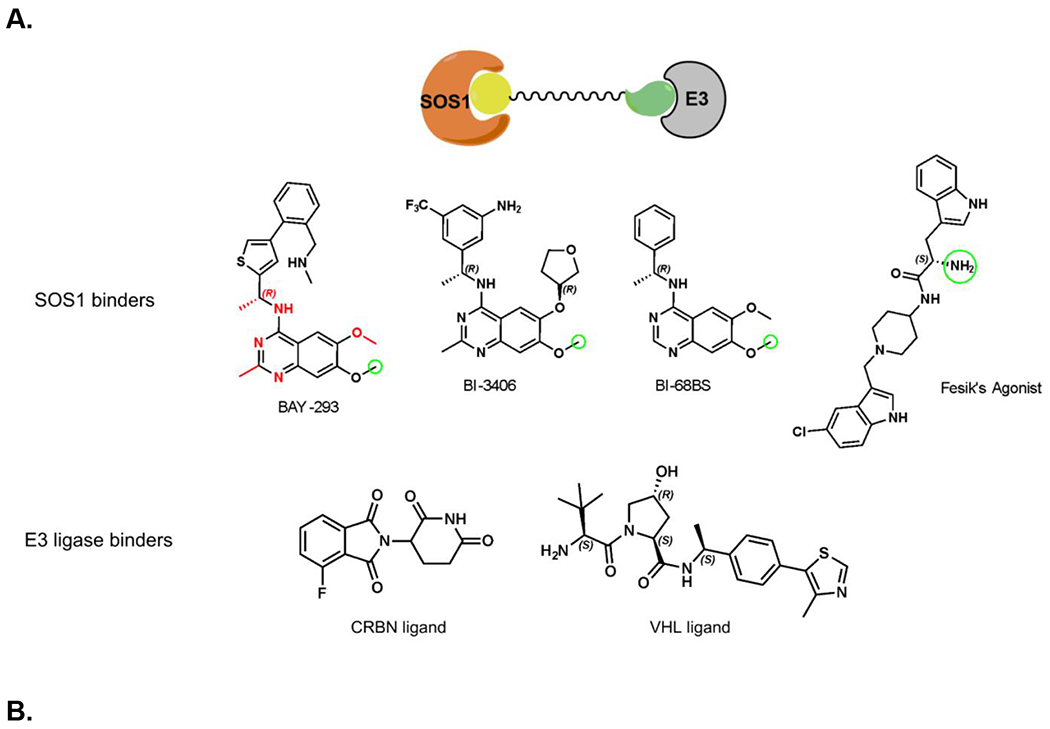
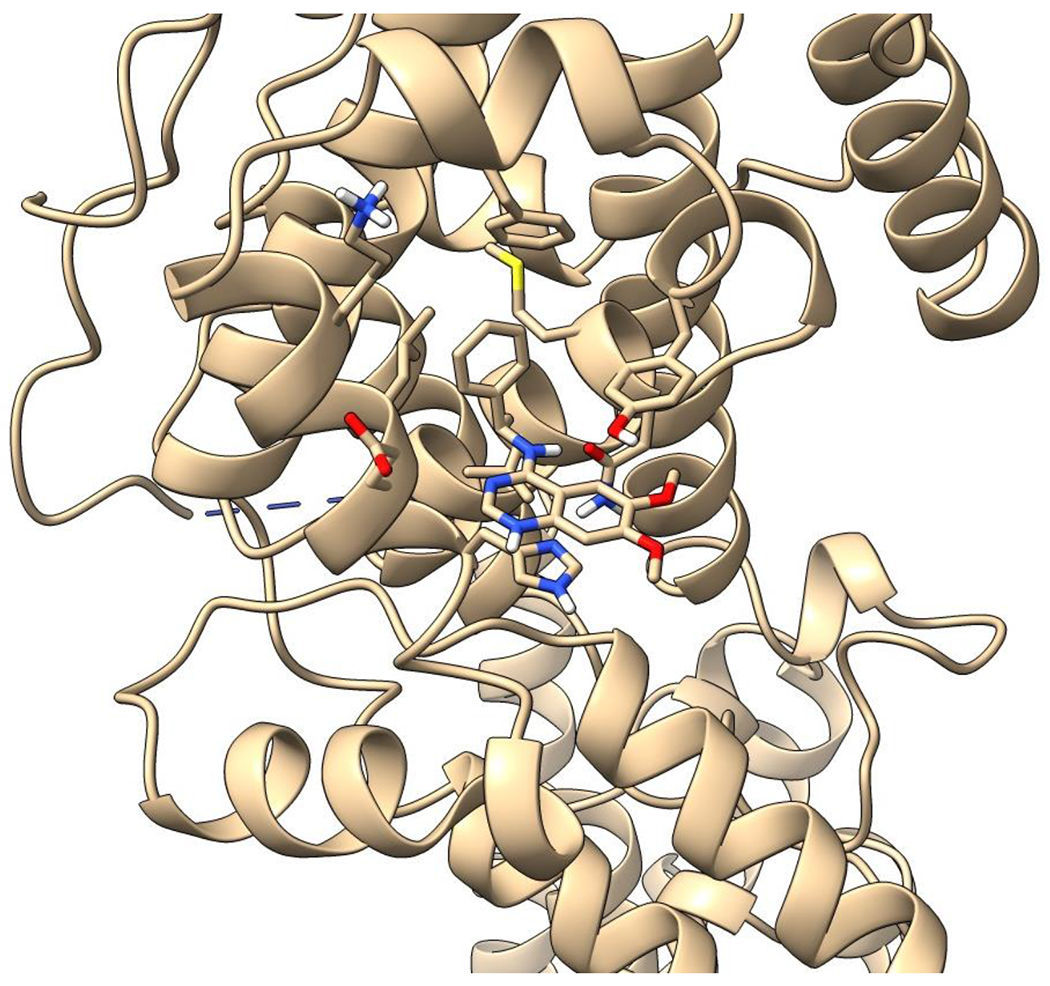
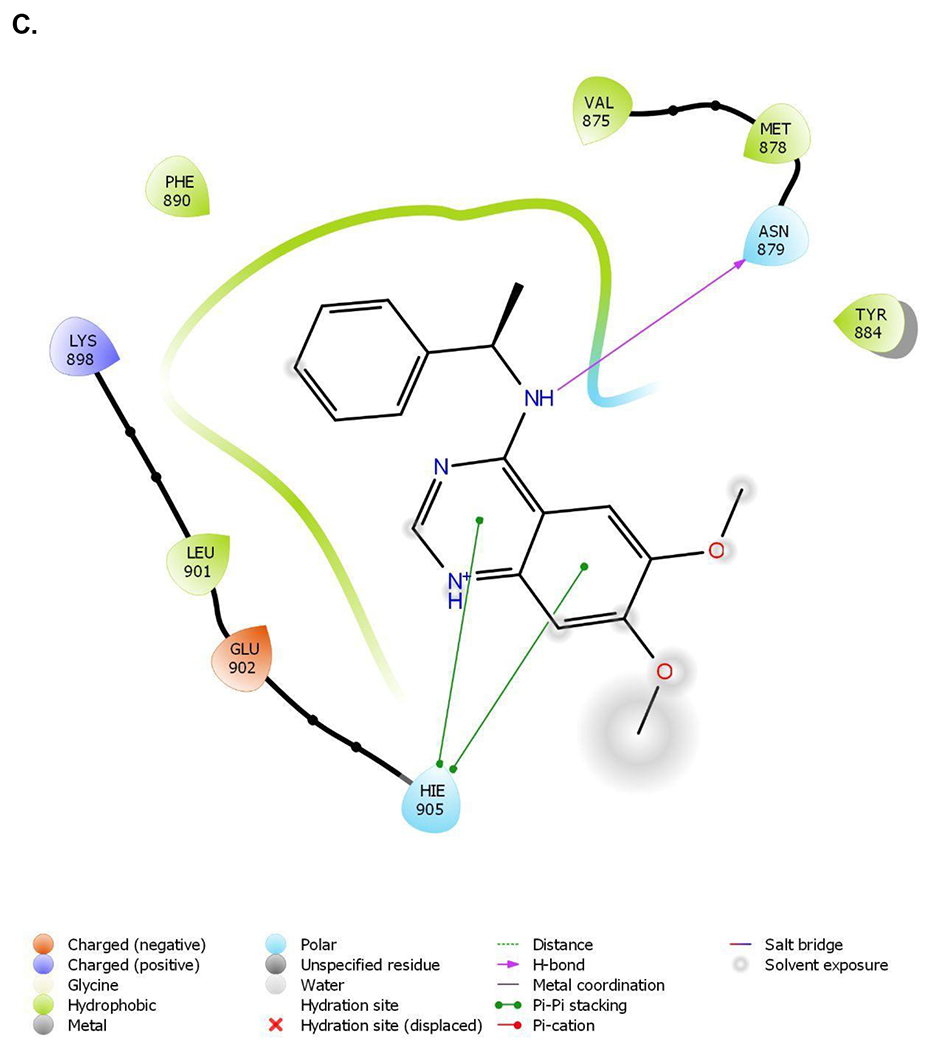
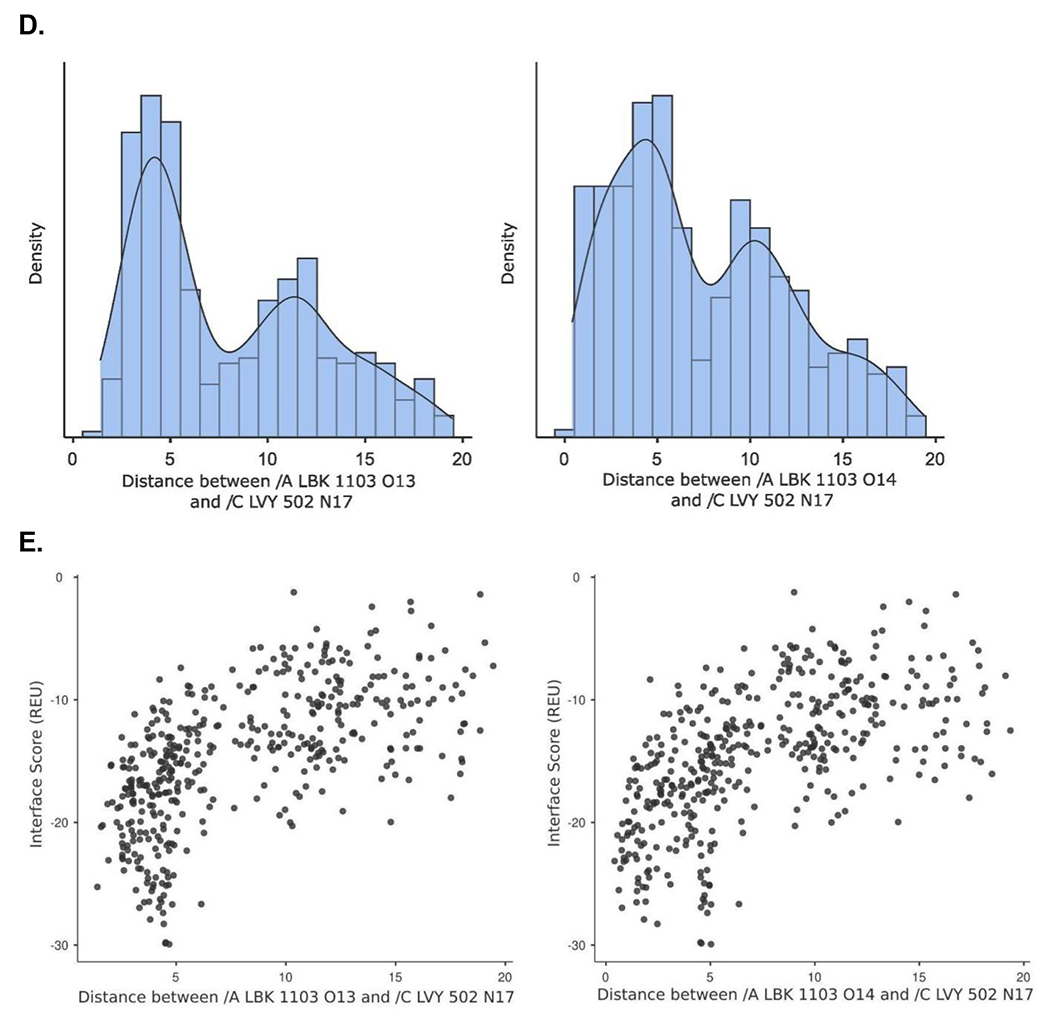
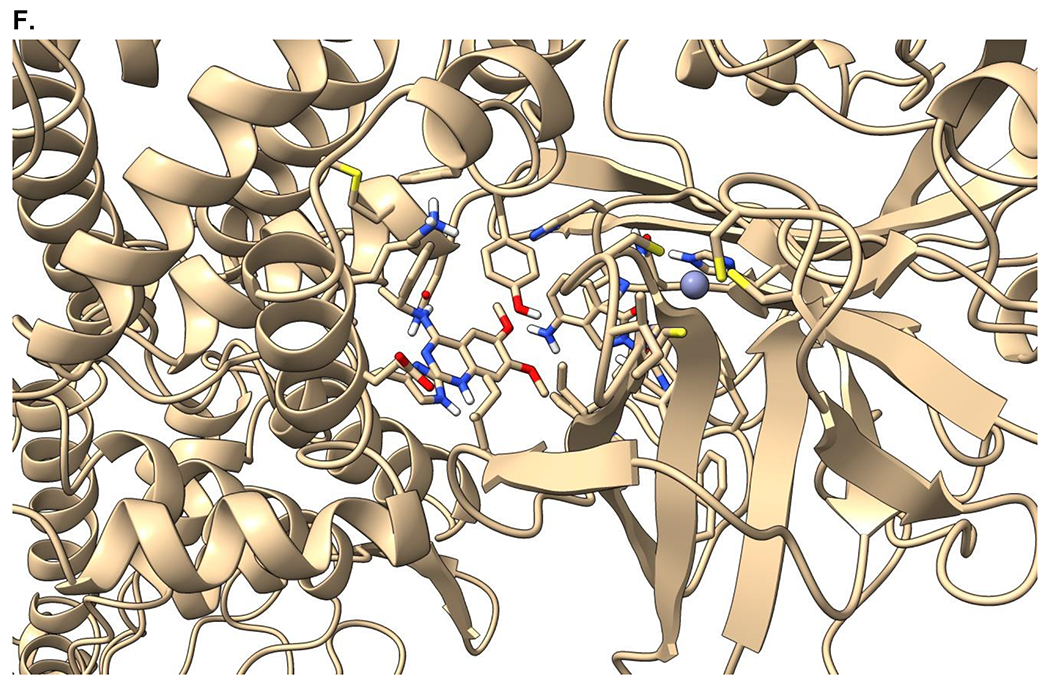
Crystal structure informed design of SOS1 PROTAC degraders. (A) A general scheme for the design of SOS1 degraders based on the PROTAC concept utilizing SOS1 binders and common E3 ligase binders. Atoms and groups in red are essential to retain the activity of SOS1 inhibition in BAY293. Groups circled in green are putative solvent exposure sites when the corresponding molecules are in complex with SOS1. (B) Crystal structure of SOS1 (PDB: 6SFR) in a complex with SOS1 binder BI68BS. (C) Structural interaction fingerprint analysis of BI68BS in a complex with SOS1 by Schrödinger-2020-3. (D) The distribution of the distance (Å) between /A LBK 1103 O13 (BI68BS 6-methoxy group) and /C LVY 502 N17 (lenalidomide amino group) and the distance (Å) between /A LBK 1103 O14 (BI68BS 7-methoxy group) and /C LVY 502 N17 in models from protein-protein docking of cereblon E3 ligase (PDB: 4TZ4) to SOS1 (PDB: 6SFR). (E) The relationship between interface score (Rosetta energy units) and the distance between /A LBK 1103 O13 and /C LVY 502 N17 and the distance between /A LBK 1103 O14 and /C LVY 502 N17 in models from the protein-protein docking. (F) An example of the most favorable conformations from the protein-protein docking. In this case, distance between /A LBK 1103 O13 and /C LVY 502 N17: 4.0 Å. Distance between /A LBK 1103 O14 and /C LVY 502 N17: 4.7 Å.
