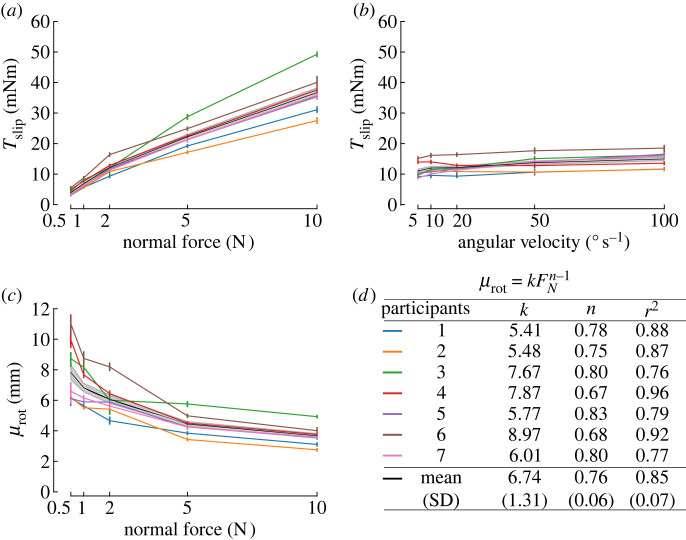
Figure 3.
Evolution of torque plateau (Tslip) with normal force and angular velocity, and evolution of the rotational coefficient of friction with normal force. In all panels, the black line is the mean across participants, with corresponding 95% confidence intervals in shaded grey. Individual participants are presented as light-coloured lines, with colours defined in (d). (a) Maximum torque for all normal forces tested. (b) Maximum torque for all angular velocities tested. (c) Coefficient of rotational friction μrot as a function of normal force (FN). (d) Least-squares fit of the coefficient of rotational friction as a function of the normal force as the power law: .

