Figure 4.
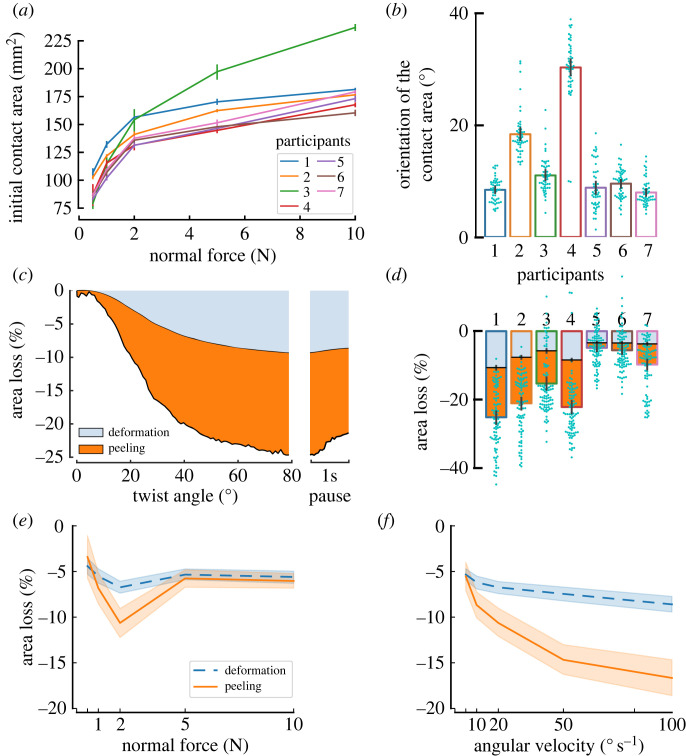
Contact area. (a) Contact area after normal loading. (b) Change of orientation of the contact area after the 80° rotation, grouped by participant. (c) Area reduction attributable to surface deformations and peeling for an example condition and participant (average of five clockwise trials at 2 N and 20° s−1); (d) relative change between initial contact area after normal loading and contact area after the 80° rotation. Proportion attributable to deformation and peeling are indicated. (e,f) Averages across participants of the area reduction after completion of the 80° rotation as a function of normal force (e) and angular velocity (f). Error bars and shaded areas represent 95% confidence intervals.

