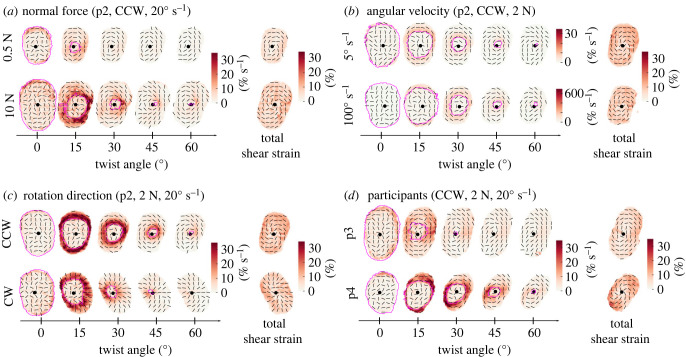
Figure 7.
Illustrative maximum shear across conditions. The centre of rotation is indicated by a black dot, the slip wavefront by a magenta contour and the maximum shear strain’s orientation by black lines. (a) Comparison of different normal forces, at 20° s−1. Comparison of maximum shear across finger pad skin for a normal force of 0.5 N versus 10 N, for a counterclockwise trial with a rotation rate of 20° s−1 (Participant 2). The heat map across each finger pad contact area illustrates the maximum shear rate at each skin location. The last column shows the total of the maximum shear for the full 80° rotation. As expected, the contact area is larger for the larger normal force. More slip happens earlier at the smaller normal force. (b) Comparison of different angular velocities, at 2 N. Comparison of maximum shear across finger pad skin for an angular velocity of 5° s−1 versus 100° s−1, for a counterclockwise trial with a normal force of 2 N (Participant 2). Since the rates of rotation differ by a factor of 20, for visualization purposes, we make the scale bar ranges also differ by this factor. Despite the large difference in the rotation rate between the two trials, there is very little difference in the spatial and temporal patterns of maximum shear rate, aside from their differing magnitudes. (c) Comparison of rotation direction, at 2 N, 20° s−1 for Participant 2. (d) Comparison of two participants, at 2 N, 20° s−1. An illustrative comparison of the time course of single trials taken from two different participants. We observe that, while the overall pattern of the time series is generally similar across these two (and all) participants, the timing of events does vary between participants; e.g. Participant 3 (p3) experiences a lot of slip early in the rotation, whereas Participant 4 (p4) achieves the same amount of slip at a later time (and larger angle of rotation).

