Figure 8.
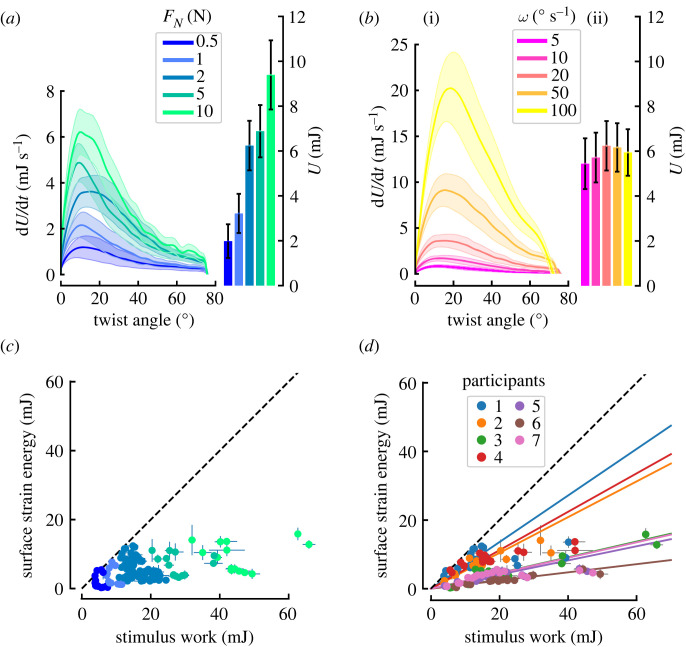
Evolution of strain energy. The influence of normal force (a) and angular velocity (b) on the evolution of the total strain energy rate (dU/dt) with respect to stimulus displacement (line graphs) and final total strain energy (bar charts). Each trace and box shows the mean across subjects. Shaded areas and bars show standard error. Note that in (b), the higher the value of ω, the less time the rotation lasts, which is why despite having higher energy rates fast angular velocities do not lead to higher time integrals. Surface strain energy versus external work. The work provided by the stimulus is the upper limit on surface deformation energy (dashed line). Only the colour code changes between (c) and (d). Note that the surface strain energy was estimated from the first experiment, while the external work was computed from the second experiment. Each data point was computed as the average value of the five repeats of the trials corresponding to a single condition. (c) Normal force increases the stimulus work as well as the surface deformation energy. (d) When colour coding by participants, it becomes apparent that the proportion of the available work converted into surface deformation decreases with the increasing normal force. Linear fits constrained to pass through the origin do not fit the data very well for participants with large deformation.

