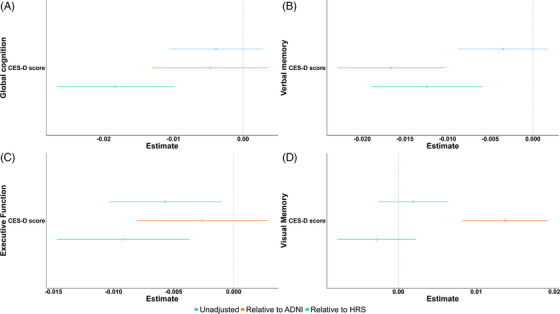
FIGURE 2.

Coefficients for depressive symptoms–cognitive domain relationship. The relationships are adjusted for age, race, education, and APOE4 carrier status. Blue lines represent the association in ARU sample (unadjusted), orange lines represent the coefficient after weighting relative to ADNI, and green lines represent the coefficient of the relationship after weighting relative to the HRS cohort. Panel A represents the relationship between CES‐D and global cognition, B between CES‐D and verbal memory, C between CES‐D and executive function, and D between CES‐D score and visual memory.
