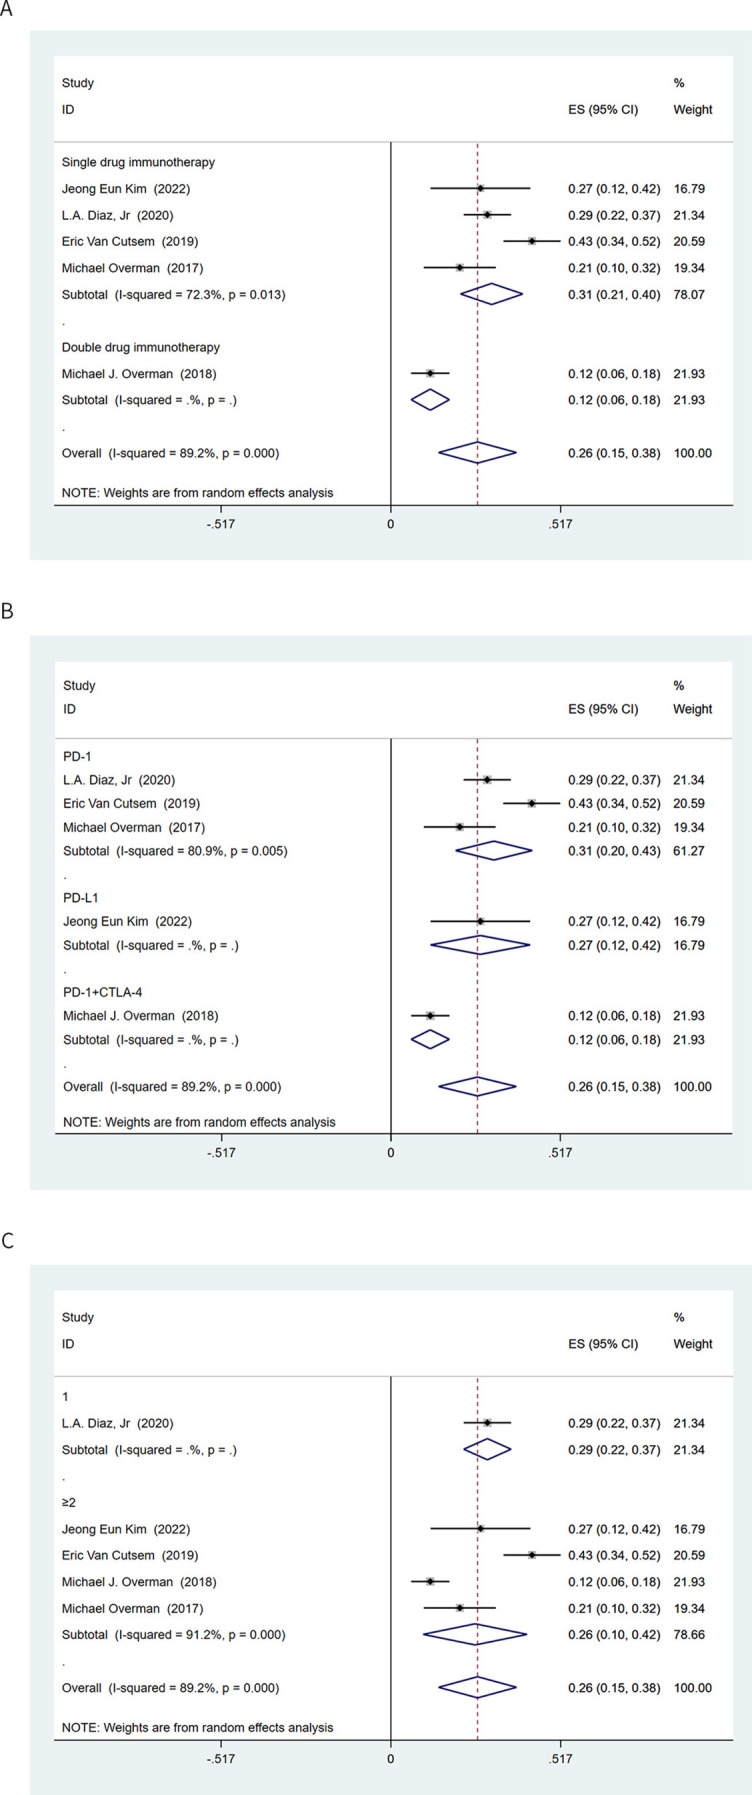
Figure 4.

Subgroup analysis based on rate of intrinsic resistance. (A) Subgroup analysis of single- and dual-drug immunotherapy; (B) Subgroup analysis of immune checkpoint inhibitors; (C) Subgroup analysis of lines of immunotherapy. ES: Effect size; CI: Confidence interval; PD-1: Programmed cell death protein 1; PD-L1: Programmed death ligand 1; CTLA-4: Cytotoxic T lymphocyte-associated antigen 4.
