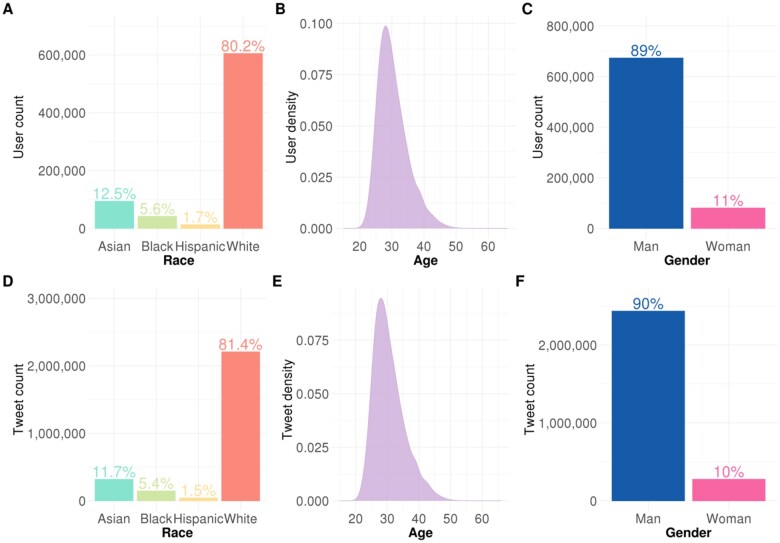
Figure 1.
Demographic distributions for the number of users (A, B, C) and the number of tweets (D, E, F). (A) Distribution of race among all users. (B) Distribution of age of all users. (C) Distribution of gender of all users. (D) Distribution of race among all tweets. (E) Distribution of age among all tweets. (F) Distribution of gender of all tweets.

