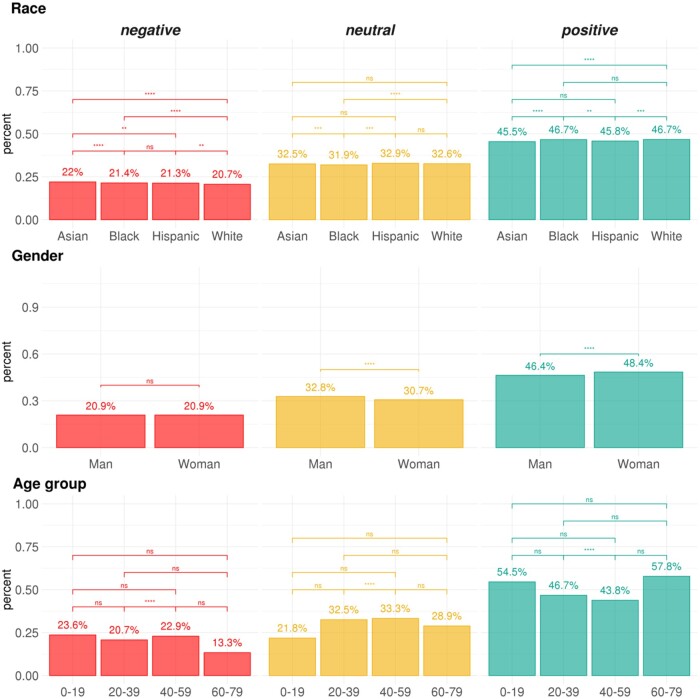
Figure 3.
Distribution of proportions of sentiments by race, gender, and age group. The first column is for negative sentiments; the second column is for neutral sentiments; the last column is for positive sentiments. ns: not significant (P-value > .05); *: .05 < P-value ≤ .01; **: .01 < P-value ≤ .001; *** .001 < P-value ≤ 1e−4; ****: P-value < 1e−4. All the P-values are adjusted for multiple tests using the FDR method.

