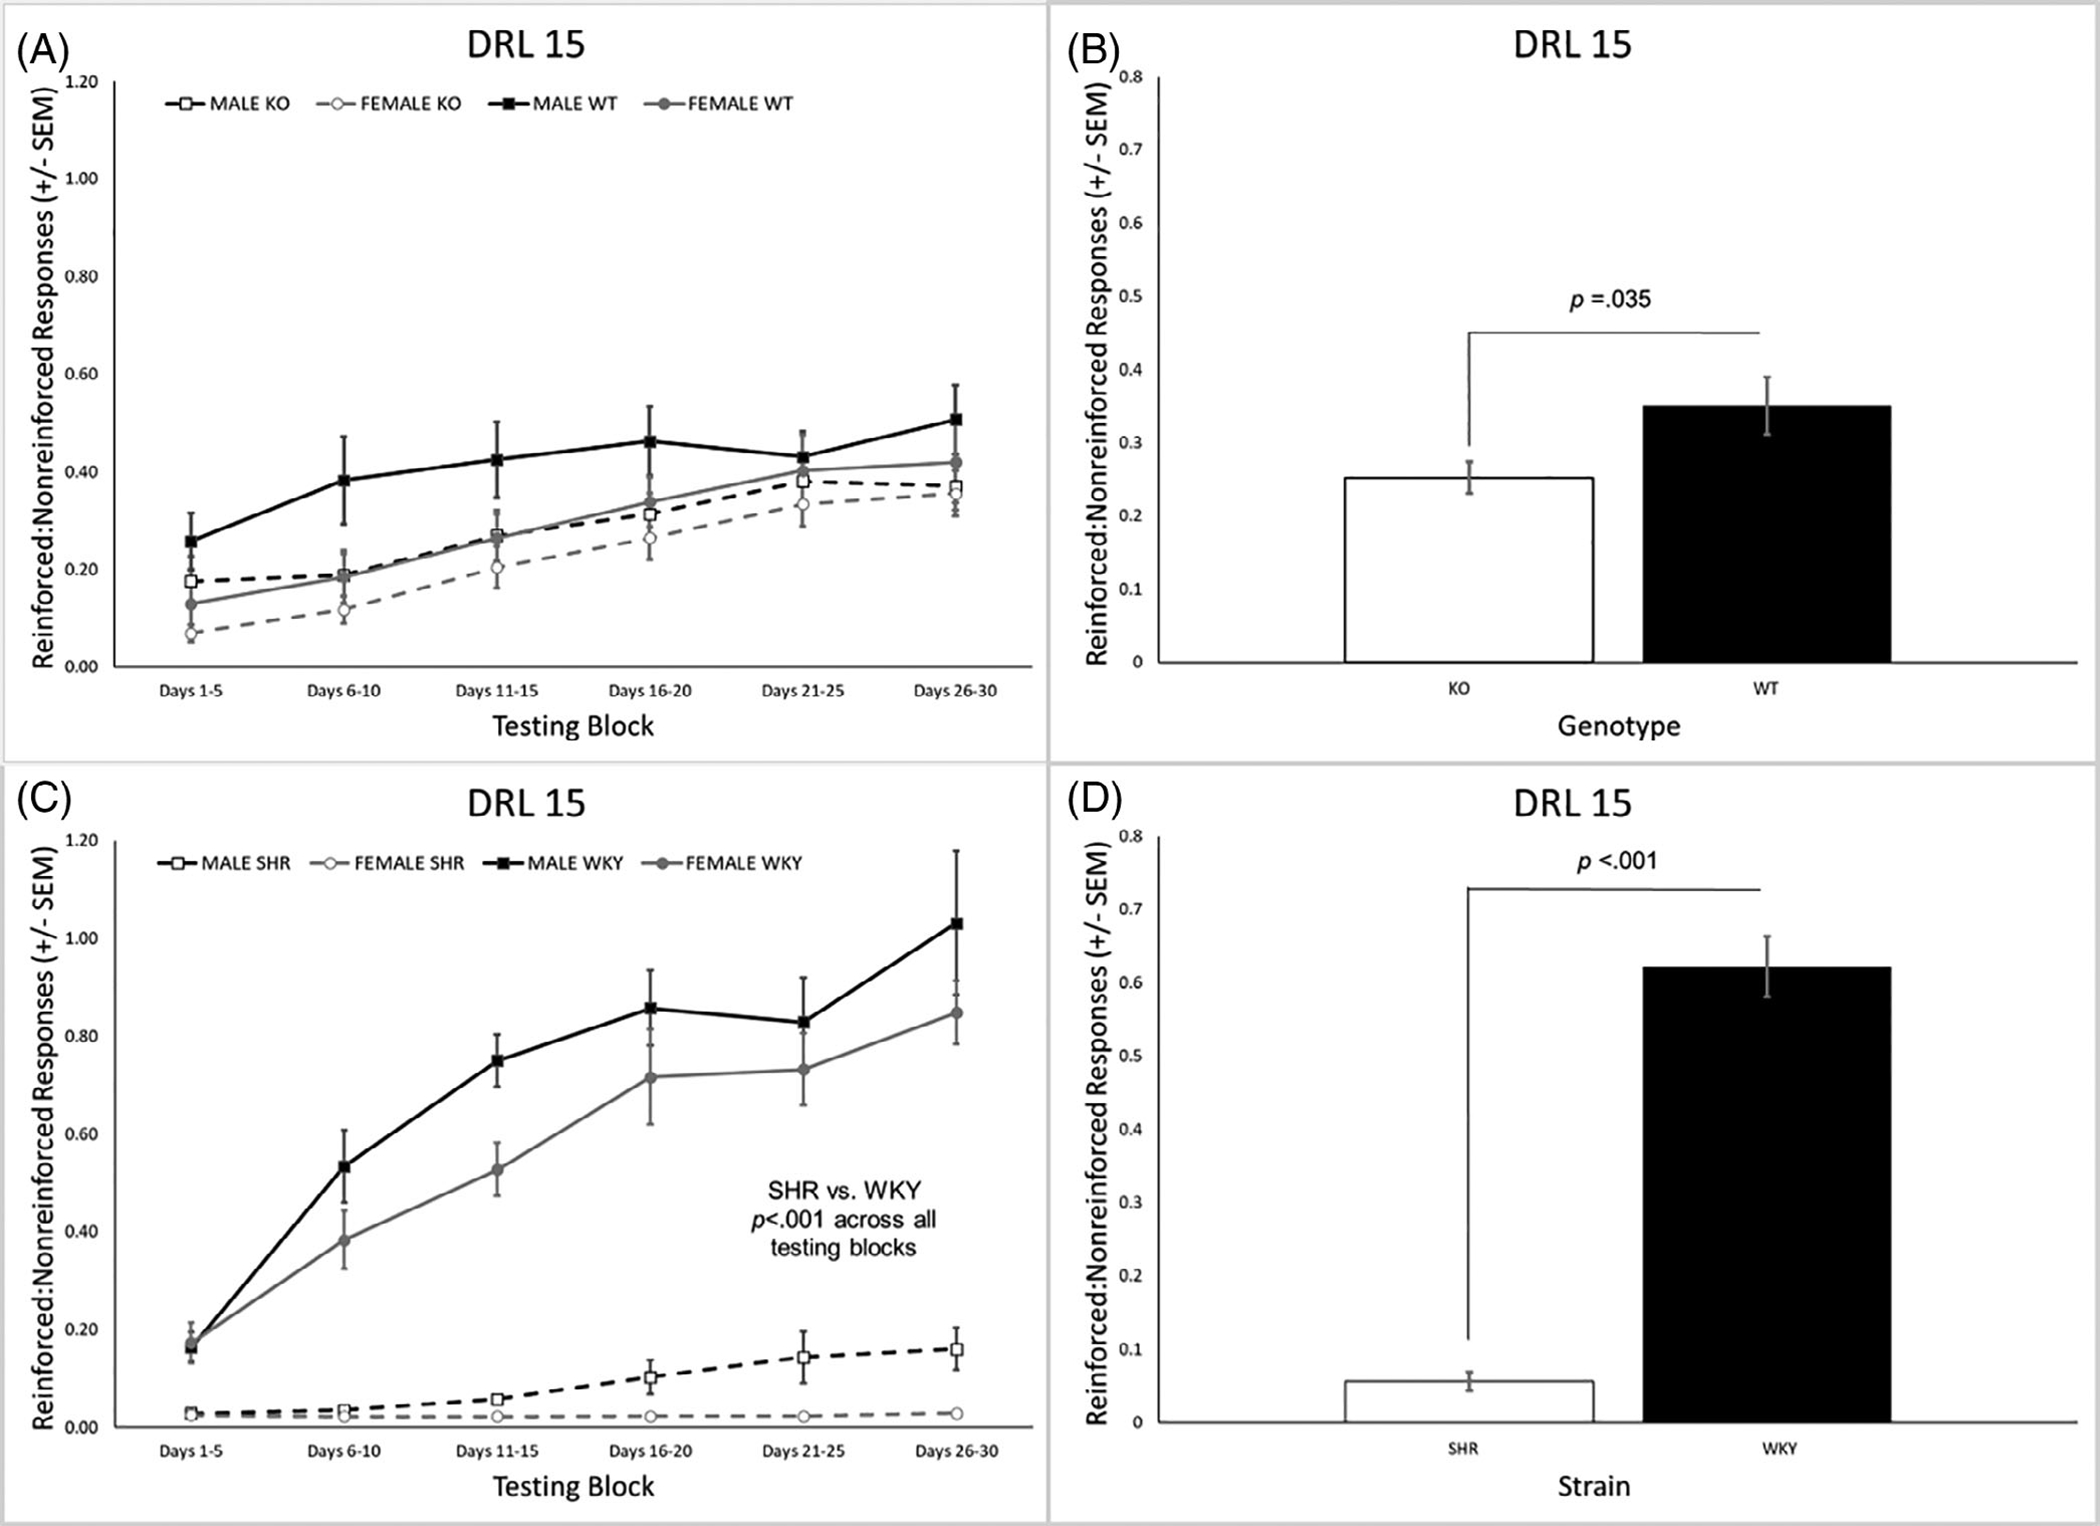
FIGURE 1.

(A) The ratio of reinforced to nonreinforced trials across all testing blocks of DRL 15 for the Lphn3 KO and WT rats. (B) Lphn3 KO rats had a significantly lower ratio of reinforced to nonreinforced trials than the WT rats. (C) The ratio of reinforced to nonreinforced trials was significantly lower for the SHRs than the WKY within each of the six testing blocks. (D) SHRs had a significantly lower ratio of reinforced to nonreinforced trials than WKY rats overall. DRL, differential reinforcement of low rates; KO, knockout; SEM, standard error of the mean; SHR, spontaneously hypertensive rat; WKY, Wistar-Kyoto; WT, wildtype
