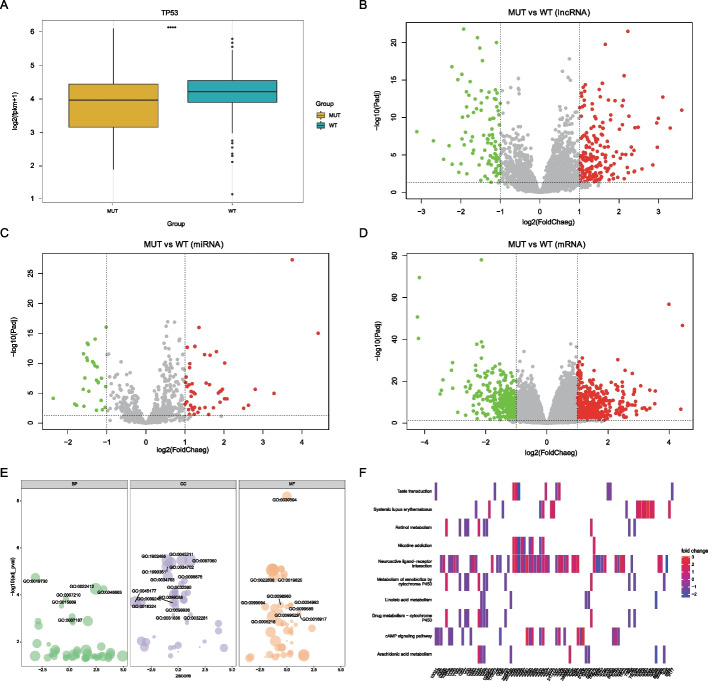
Fig. 4.
Differentially expressed genes analysis in mutated and wild-type TP3 groups in the cohort of patients with lung adenocarcinoma. A Association between the TP53 mutation and the TP53 expression. B–D Differential expression analysis. The horizontal axis is the log2 Fold Change, and the vertical axis is -log10(Adjust P value), Red nodes represent upregulation, blue node represent downregulation, and the gray node represents non-significant expression. B represents differentially expressed lncRNA, C represents differentially expressed miRNA, and D represents differentially expressed mRNA. E GO enrichment analysis was performed on differentially expressed mRNA. (F)KEGG pathway enrichment analysis

