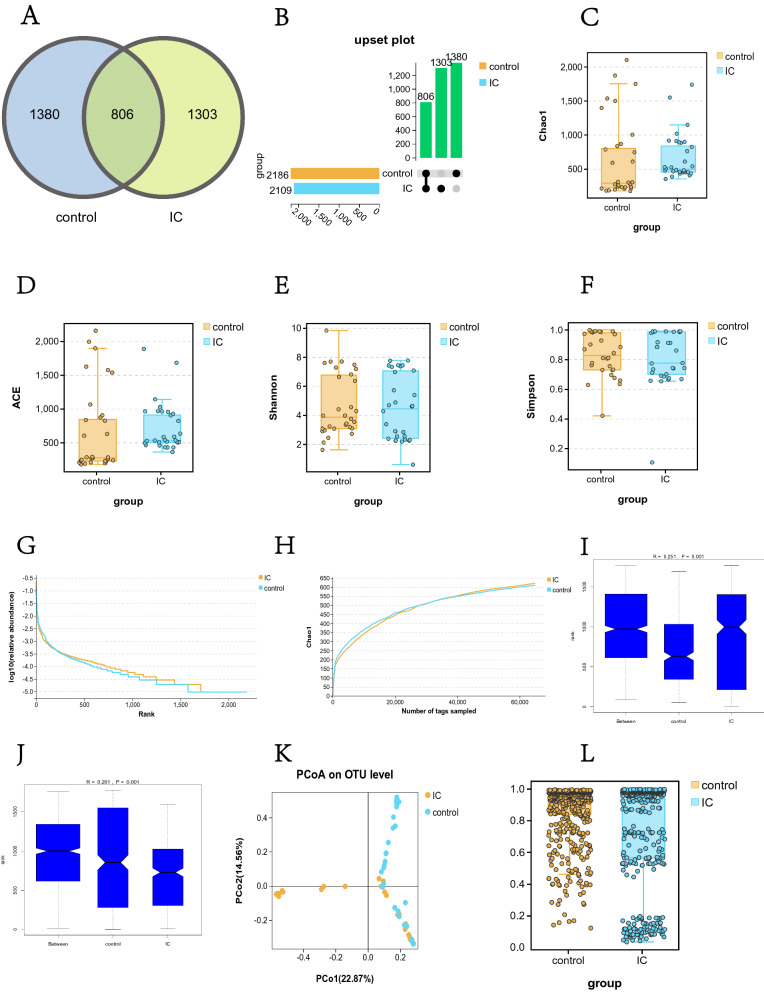
Fig. 1.
Comparison of urinary microbial diversity between the IC/BPS group and the control group. A Venn diagram of OTU clustering and B UpSet plot showing 1380 OTUs in the control group, 1303 OTUs in the IC/BPS group, and 806 OTUs shared by the two groups (C: Chao1 index, D: ACE index, E: Shannon index, F: Simpson index). -diversity analysis indicated that there was no significant difference in -diversity between the two groups (P > 0.05). G The close proximity of the two rank abundance curves further showed that there was no significant difference inβ-diversity between the two groups. H The dilution curve tended to be flat, indicating that the sequencing depth was sufficient. I Weighted ANOSIM test and J unweighted ANOSIM test, R > 0 and P = 0.001 indicated that the intergroup difference was greater than the intragroup difference, which means that our grouping was valid. K PCoA plot showing the similarity of the urinary microbiota between the two groups. L The β-diversity statistical test results indicated that the β-diversity between the IC/BPS group and the control group was significantly different (Bray distance index, OTU level, Welch's t test, P < 0.01)

