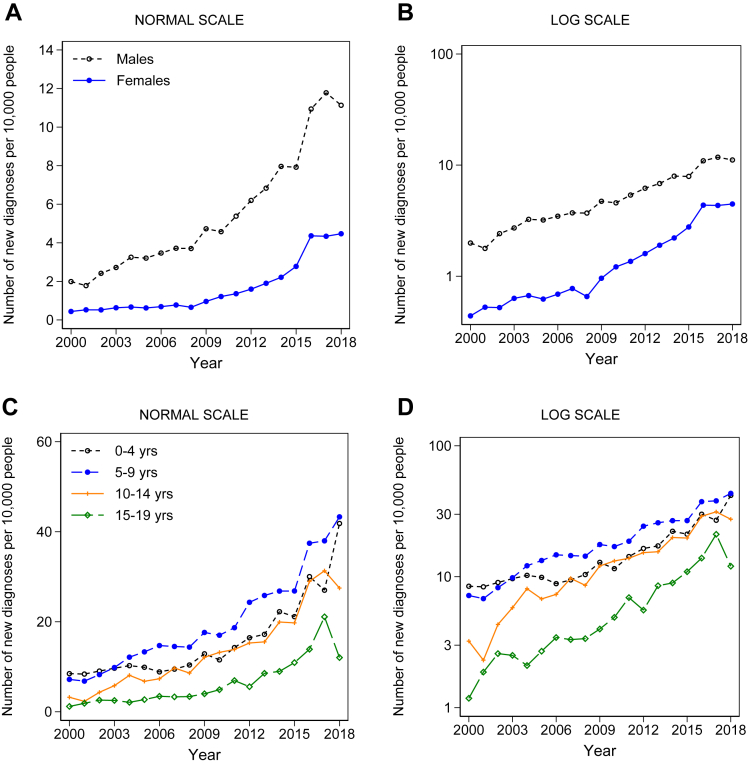
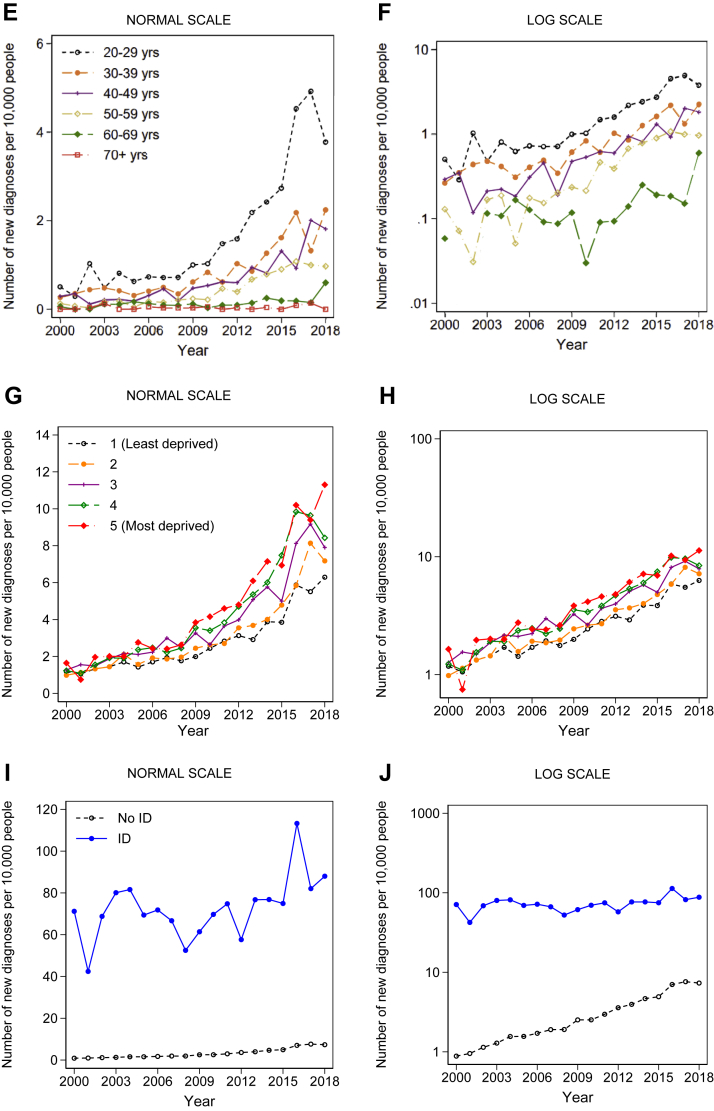
Fig. 3.
Historical trends in annual rates of diagnoses from 2000 to 2018 stratified by: (A) sex, (B) sex on a log scale; (C) age-band: people aged under 20 (D) age-band: people aged under 20 on a log scale; (E) age-band: people aged 20+ (F) age-band: people aged 20+ on a log scale; (G) socioeconomic deprivation; (H) socioeconomic deprivation on a log scale; (I) intellectual disability (ID); (J) intellectual disability (ID) on a log scale. Note: F: there were no new autism diagnoses in the 60- to 69-year age-group in 2002. eFigs. S5–S8 present these results for males and females separately. eFigs. S9–S12 present these results for individuals with and without ID separately.


