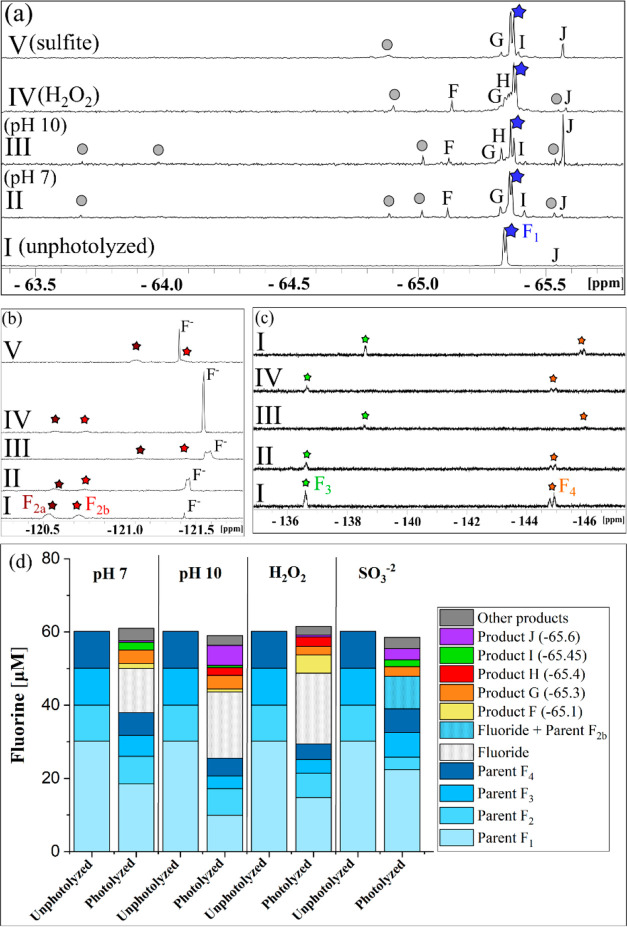
Figure 5.
(a–c) 19F-NMR spectra and (d) fluorine mass balance plots for sitagliptin (compound 4b) before photolysis (I) and after photolysis in pH 7 phosphate buffer (II), pH 10 borate buffer (III), pH 7 buffer with 1 mM H2O2 (IV), and pH 10 with 0.5 mM SO32– (V). Panels a–c show that the parent compound had four fluorine motifs i.e. one Ar–CF3 (blue star, F1 doublet) and three Ar–F (brown star F2a and red star F2b from a single fluorine, green star F3 singlet, and an orange star F4 doublet). Product fluorine peaks include F, G, H, I, and J all in 1a. The gray circles indicate other smaller product fluorine peaks and details can be found in the SI. (d) Fluorine mass balance plots for initial (unphotolyzed) and final (photolyzed) samples of sitagliptin for each photolysis matrix. Products F–J and other products shown in the figure are all near the F1 peak (Py-CF3 peak). The y-axes scales for panels a–c are different and have been adjusted to show full peaks. The internal standard peak for HFB is not shown in this figure. Peak 2b and F– occur together in panel b for V conditions but could be separated for mass balances because F2a and F2b had the same concentrations in all samples. Errors associated with the mass balances are shown in Table S13.

