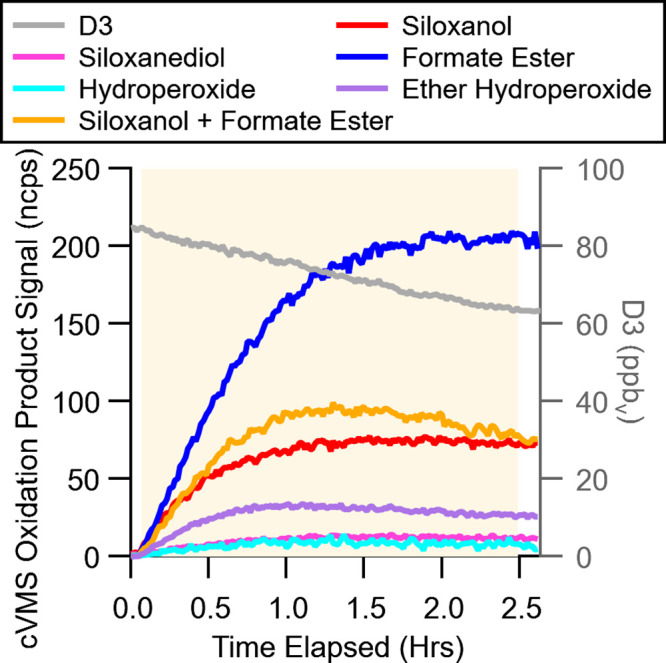
Figure 1.

Example time series of D3 oxidation with H2O2 as oxidant precursors. The shading signifies when the lights are on, and the dashed vertical line signifies when 10% of D3 had been oxidized. Signals averaged to 1 min time resolution are shown.
